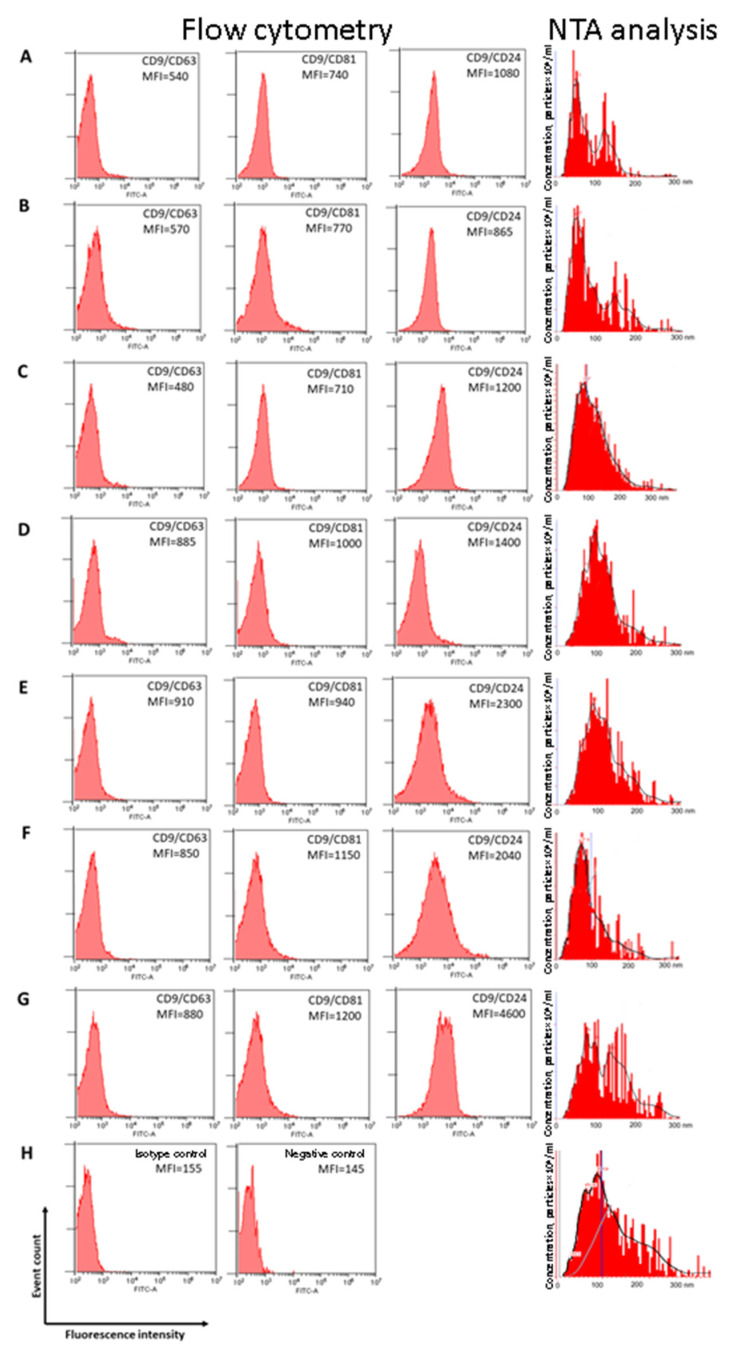
Figure 2.
Exosomes characterization by flow cytometry and NTA analysis. For flow cytometry mean MFI are shown. Size distribution and expression of CD63, CD81, and CD24 on CD9-positive exosomes of (A) blood plasma HFs; (B) blood plasma of BBTPs; (C) blood plasma of BCPs; (D) blood plasma of OCPs; (E)ascitic fluid of OCPs; (F) blood plasma of patient with BOTPs; (G) ascitic fluid of patient with BOTPs; (H) Isotype control (left) and negative control (right).

