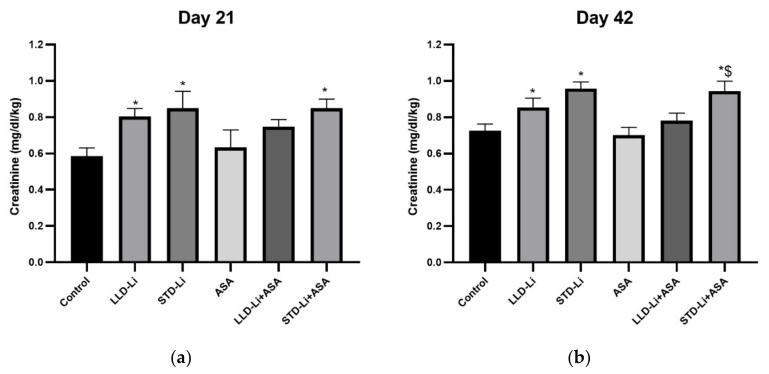
Figure 3.
Plasma creatinine levels in aspirin + Li-treated rats. Rats were fed regular food (control) or Li-containing food (LLD-Li or STD-Li) for 42 days. Low-dose ASA (1 mg/kg, ip) was administered alone or as add-on to Li. On days 21 (a) and 42 (b) blood was collected, plasma separated, and creatinine levels determined as described in Materials and Methods. Presented are creatinine levels adjusted to rat’s body weight. The figure summarizes the combined results of two independent experiments demonstrating a similar pattern. Results are the means ± SEM of 9–12 rats per group. (a) Two-way ANOVA: ASA effect, F1,64 = 0.6556, p = 0.6874; Li effect, F2,64 = 10, p = 0.0002; aspirin x Li interaction: F2,64 = 0.3770, p = 0.6874. Post hoc Fisher’s LSD test: Control vs. LLD-Li, p = 0.0274; Control vs. STD-Li, p = 0.0005; Control vs. STD-Li + ASA, p = 0.0064. (b) Two-way ANOVA: aspirin effect, F1,112 = 1.031, p = 0.312; Li effect, F2,112 = 14.79, p < 0.0001; aspirin X Li interaction: F2,112 = 0.2559, p = 0.775. Post hoc Fisher’s LSD test: Control vs. LLD-Li, p = 0.045; Control vs. STD-Li, p = 0.0003; Control vs. STD-Li + ASA, p = 0.0006; LLD-Li + ASA vs. STD-Li + ASA, p = 0.0095. Asterisks and symbols denote the following: *—p < 0.05 vs. Control, $—p < 0.05 vs. LLD-Li + ASA. Abbreviations: ASA—acetylsalicylic acid, LLD—low-low dose, Li—lithium, STD—standard dose.

