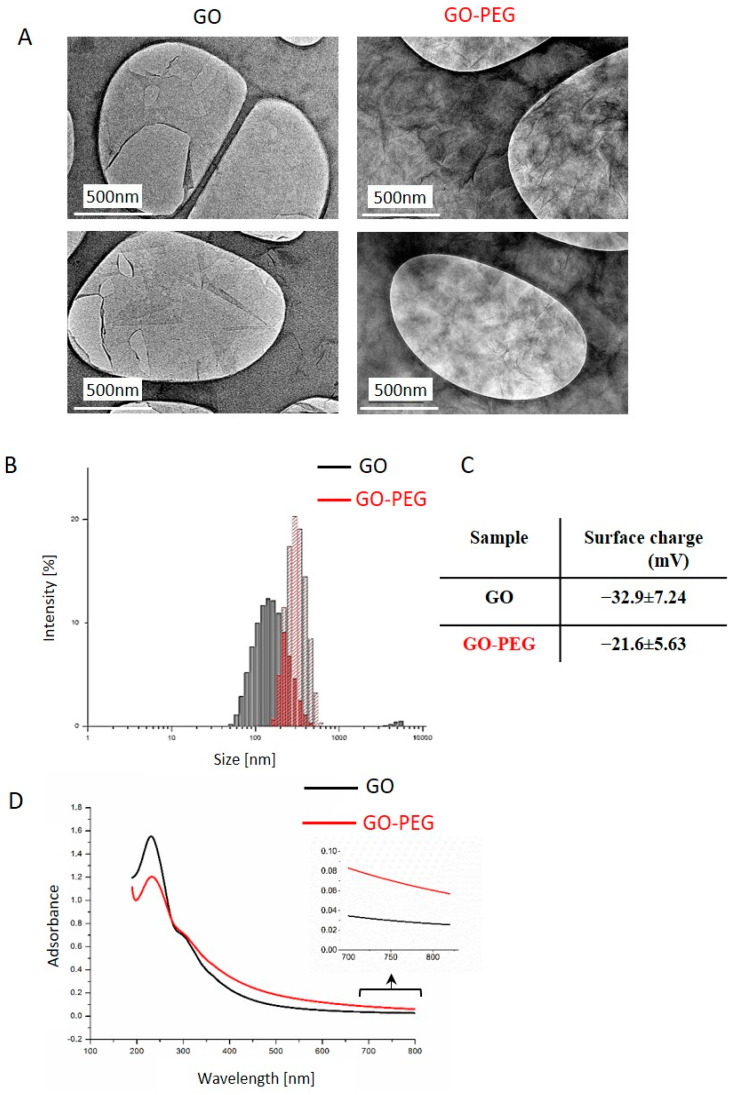
Figure 1.
Physiochemical properties of GO and GO–PEG NPs. (A) Representative TEM images of GO and GO–PEG water dispersions, sonicated 1 h at 40 Hz (B) Size distribution analysis of GO and GO–PEG. Aqueous dispersions of GO and GO–PEG at 1 mg/mL were characterized by DLS after sonication using a particle size analyzer. The histogram shows the average values from triplicate measurements. (C) Zeta potential of GO and GO–PEG in water solution. (D) Characterization of GO and GO–PEG by ultraviolet-visible spectroscopy with an insert with the enlargement of the NIR region between 700–820 nm. At least three independent spectroscopic measurements were conducted for each sample.

