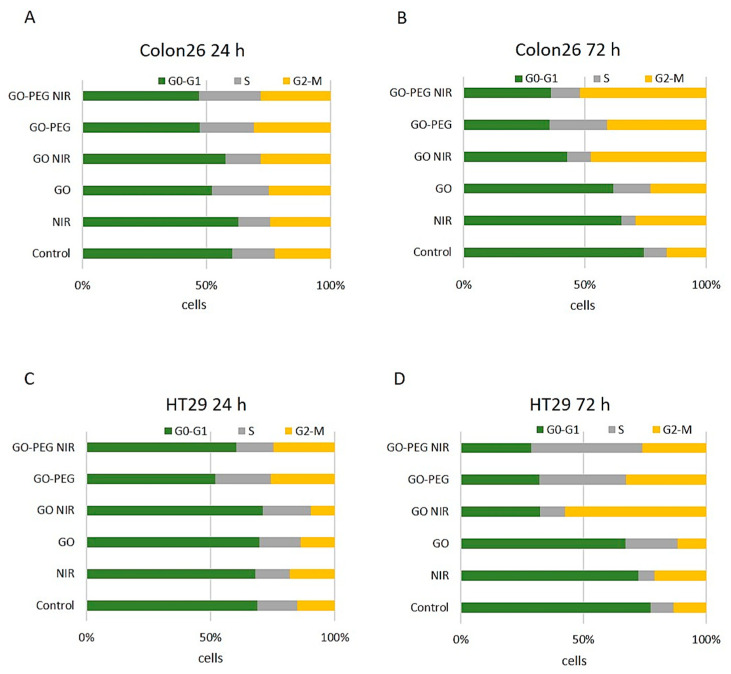
Figure 5.
Cell cycle analysis of Colon26 and HT29 cells after PI staining and treatment with GO and GO–PEG NPs with and without NIR via FACS. (A) Distribution of Colon26 cells cultivated for 24 h in the presence of NPs with and without NIR irradiation in the cell cycle phases. (B) Distribution of Colon26 cells cultivated for 72 h in the cell cycle phases. (C) Distribution of HT29 cells cultivated for 24 h in the presence of NPs with and without NIR irradiation in the cell cycle phases. (D) Distribution of HT29 cells cultivated for 72 h in the cell cycle phases. Values are MEAN of % of cells from three repetitions.

