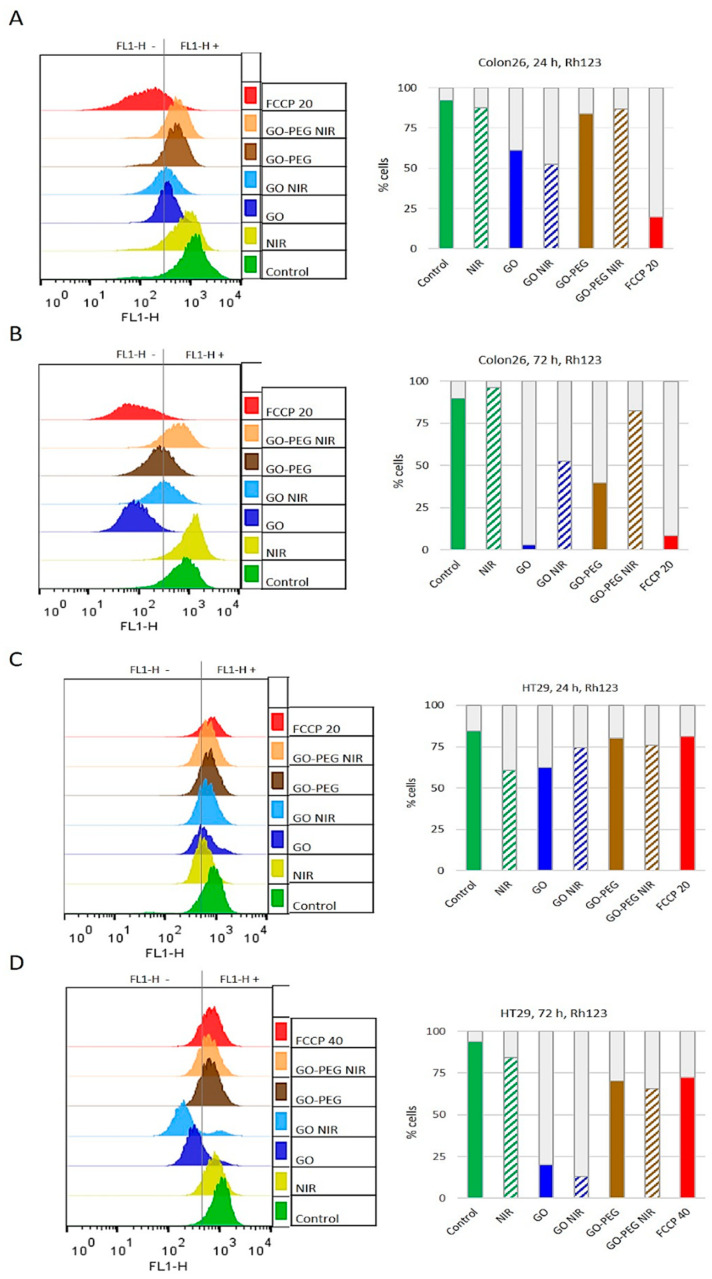
Figure 7.
Mitotoxicity of GO nanoparticles and NIR by Rhodamin123 staining assessed by FACS observation. The mitochondrial activity was detected by FACS based on the incorporation of ∆Ψ-sensitive Rh123 fluorescent dye in viable cells. Histograms represent Rh123 fluorescence acquired by flow cytometer using FL1-H detector. The charts show the distribution of gated viable cells (FSC/SSC) according to the intensity of their Rh123 (FL1-H) fluorescence. (A) Colon26 cells after 24 h incubation with NPs. (B) Colon26 cells after 72 h of NPs treatment. (C) HT29 cell—24 h after incubation with NPs. (D) HT29 cells—72 h of treatment with NPs.

