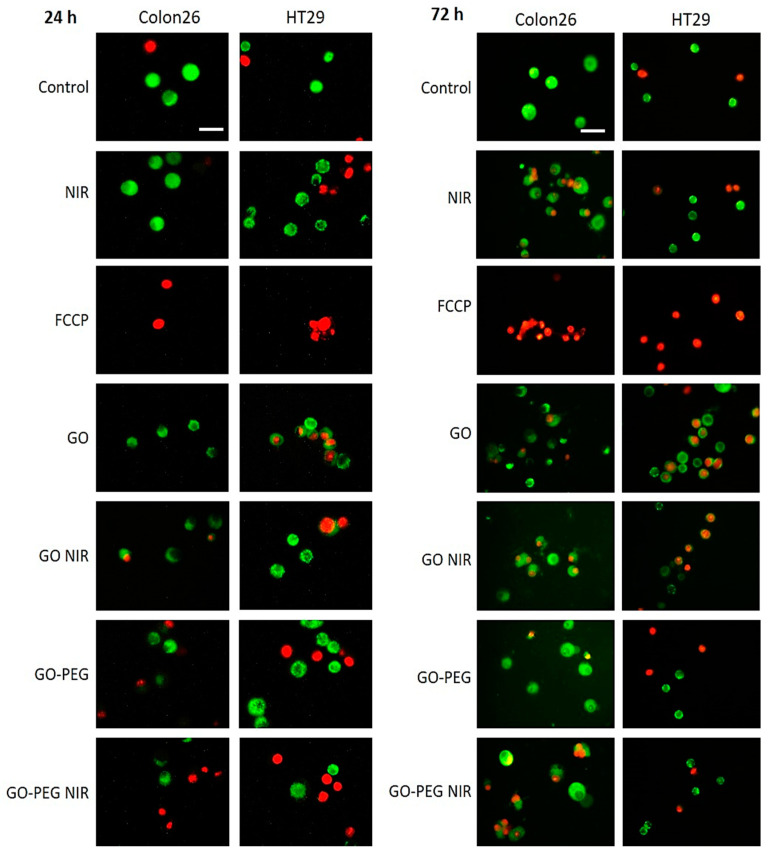
Figure 8.
Fluorescent microscopy of mitochondrial morphology in Colon26 and HT29 cells incubated with GO and GO–PEG with and without NIR irradiation. Cells were stained with Rh123 at the two tested time points, 24 h and 72 h, and were visualized under an epifluorescent microscope. Representative epifluorescence images after staining with Rh123 and PI are displayed. Viable cells are green, whereas dead cells are red, due to accumulation of Rh123 and PI, respectively. White bars stand for 100 µm.

