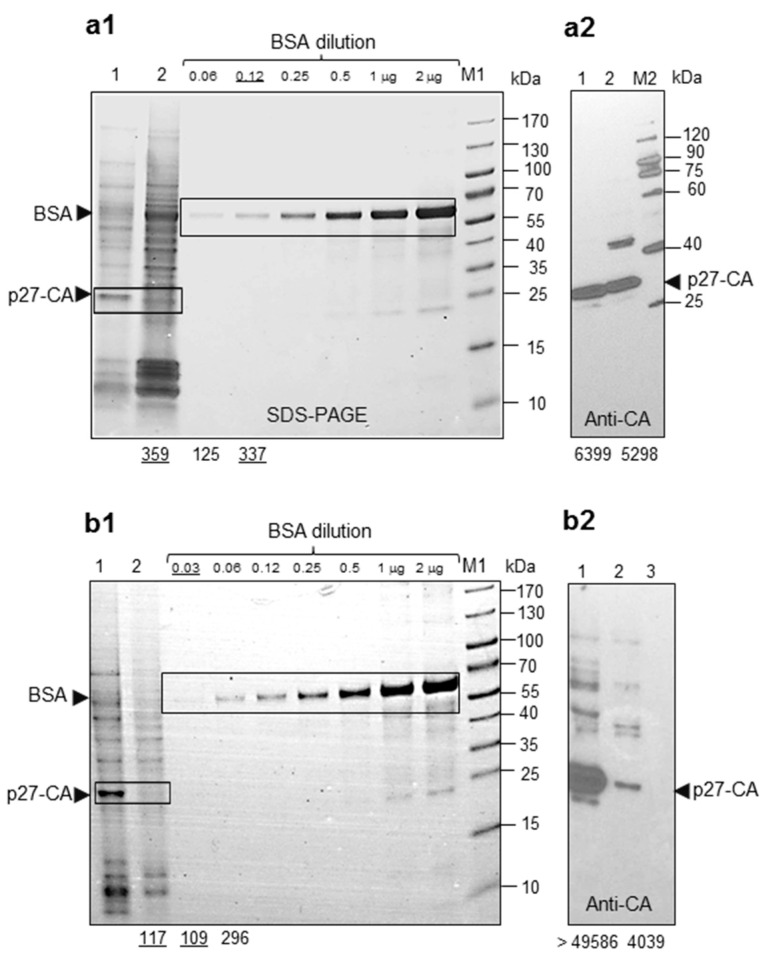
Figure 6.
Estimation of CA/virions release from GH (a) and Tera-1 cells (b). Viruses were purified on 20% sucrose cushion and concentrated × 2 K, as described (Section 4.3). Serial dilution of bovine serum albumin (BSA, Fraction V) was used for protein quantification. BSA load (ng/µg) is indicated above the tracks. (a1) estimation of CA release from GH cells. Track 1. Recombinant HML.2 (conc. × 200) used for direct CA comparison and comparative Western blot analyses, load 8 µL; Track 2—HML.2 GH, load 8 µL. After electrophoresis the gradient gel was stained with Fast-blue (Roth, Germany). (a2) comparison of CA amount in recombinant ERV-K and in ERV-K GH by Western blot analysis using anti-p27-CA serum; (b1) estimation of HML.2 CA released from Tera-1 cells. The same methodology as above (a1) was applied; (b2) track 1. Recombinant HML.2 (conc. × 200), load 8 µL; Track 2. HML.2 Tera-1, load 8 µL; Track 3. Supernatant from HEK293T cells (conc. × 2 K). Size markers M1 (PageRuler) and M2 (VisiBlot) were used for calibration. A comparison of protein load was performed using ImageJ. Numbers below the figures are corresponding to the relative intensity of the bands. Underlined numbers indicated close intensity of the reference and examined sample bands.

