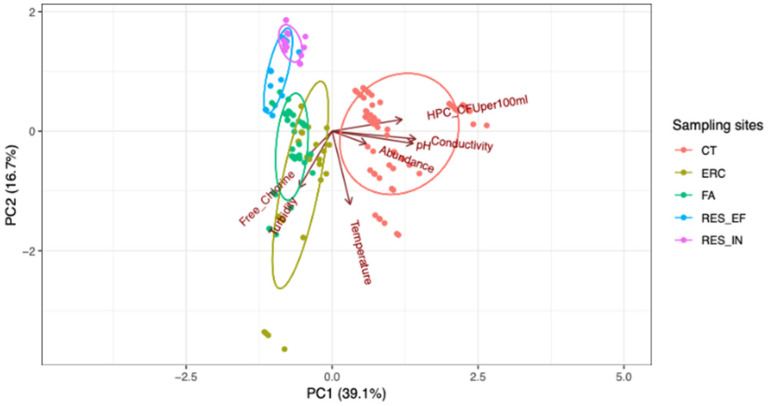
Figure 1.
Principal component analysis (PCA) biplot showed a clear separation between water samples collected from the cooling towers relative to those collected from the drinking water system (Fa, ERC, RES_IN, and RES_EF). Each data point represents each species from a particular sampling site (the observation). Samples from five sampling locations, color-coded based on sampling location. The absolute abundance of Legionella and amoebae species at each sampling site is depicted in the graph.

