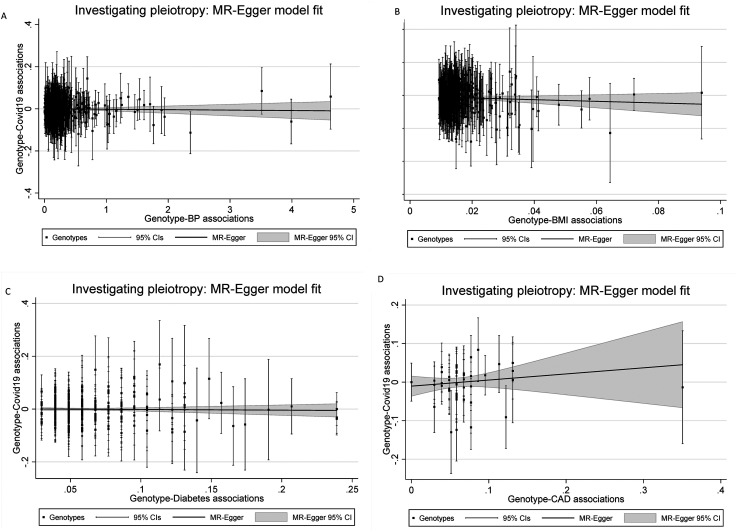
Figure 1.
Scatter plot of genetic associations with the outcome (y axis) against genetic associations with the exposure (x axis). A) Effect of genetically predicted BP on risk of susceptibility with COVID-19. B) Effect of genetically predicted BMI on risk of susceptibility with COVID-19. C) Effect of T2DM on risk of susceptibility with COVID-19. D) Effect of CAD on risk of susceptibility with COVID-19. The slope of the regression line represents the causal association.

