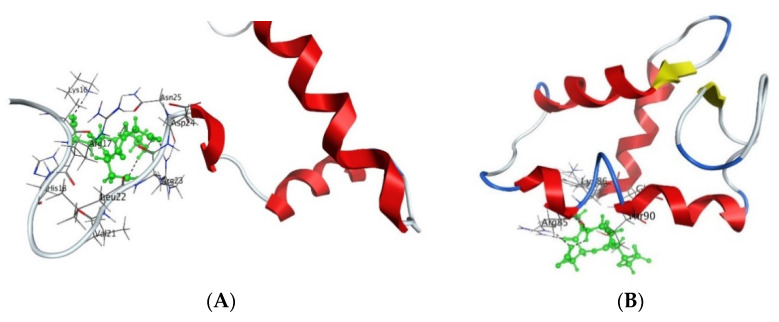
Figure 3.
Interaction of AEDG peptide with H4 histone (A) and H1/6 histone (B) in accordance with the data obtained from the forcefield molecular modeling (Molecular Operating Environment, forcefield Amber12EHT). Histone molecules (Protein Data Bank) are depicted as α-helical domains and loops. Oxygen atoms are shown in red, nitrogen atoms in blue, carbon atoms in black, and hydrogen atoms in light gray. The peptide is highlighted in green. The dotted line shows hydrogen bonds.

