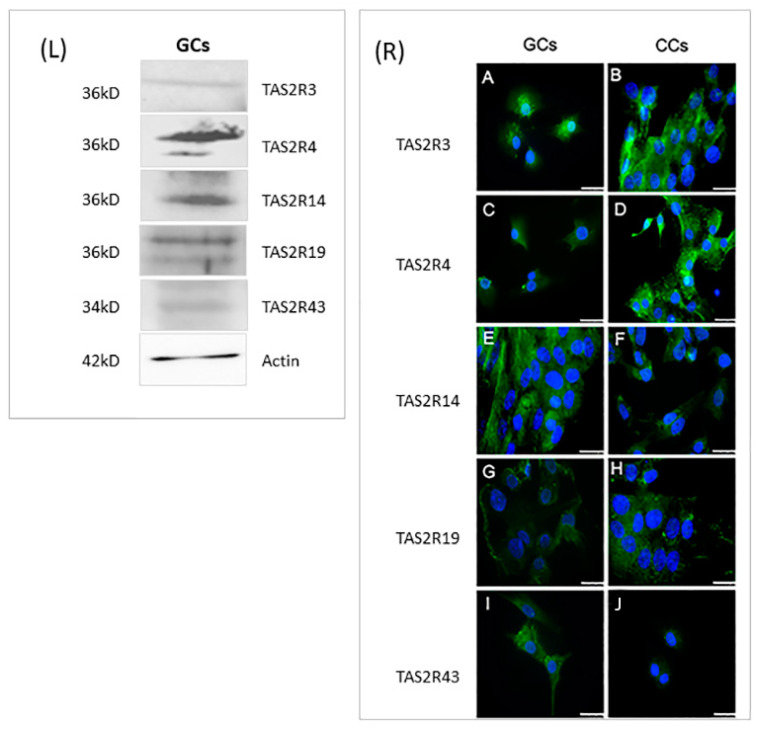
Figure 4.
Left panel (L): Representative image of Western blot of TAS2R3, TAS2R4, TAS2R14, TAS2R19, and TAS2R43. β-actin was used as loading control. Right panel (R): Immunofluorescence localization of (A,B) TAS2R3, (C,D) TAS2R4, (E,F) TAS2R14, (G,H) TASR19, and (I,J) TAS2R43 in (A,C,E,G,I) granulosa and (B,D,F,H,J) cumulus cells. TAS2Rs are stained in green. Nuclei were counterstained with DAPI (blue). Scale bar = 15 µm. Negative controls are shown in Figure S1.

