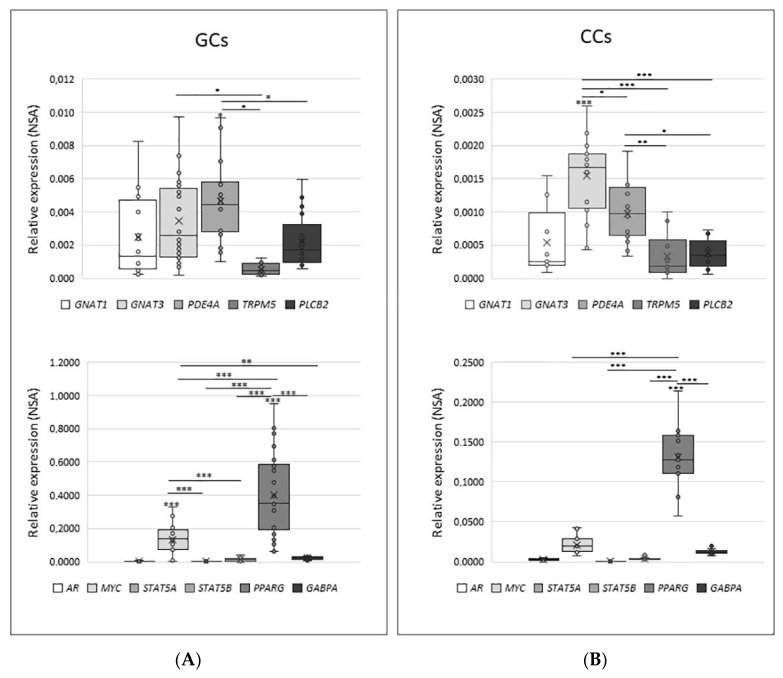
Figure 6.
Relative quantity expression of genes involved in transduction cascade in GCs panel (A) and in CCs panel (B). Graphical diagrams are plotted as box–whisker plots, where boxes show the interquartile range with median and mean values, and whiskers represent min and max confidence intervals. Statistically significant differences in NSA levels were tested by Kruskal–Wallis one-way analysis of variance followed by the Dunn’s post-hoc test. * p < 0.05, ** p < 0.01, *** p < 0.001.

