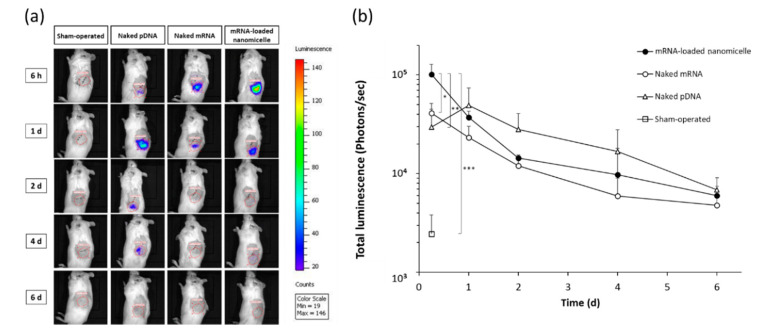
Figure 2.
Time course of luciferase expression in the left kidney after renal pelvis injection of messenger RNA (mRNA) or plasmid DNA (pDNA) before in vivo imaging was performed. (a) Representative IVIS images of mice at 6 h, 1, 2, 4, and 6 d after renal pelvis injection of naked pDNA, naked mRNA, or mRNA-loaded polyplex nanomicelles. (b) Quantification of luciferase expression was performed with the total luminescence (photons/sec) in the left kidney was determined by same size of ROI. Data are represented as mean + SD (n = 3–4). * p < 0.05, ** p < 0.01, *** p < 0.001 (Tukey’s test).

