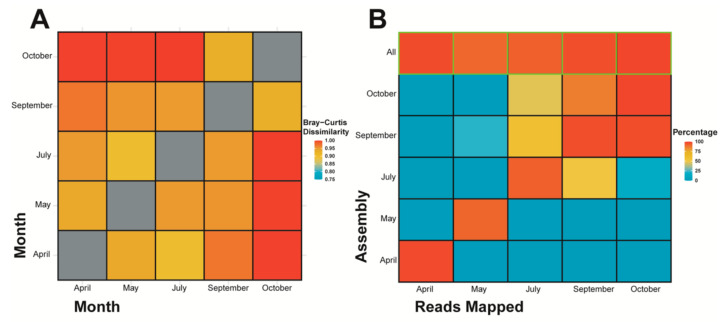
Figure 4.
A comparison between samples done using (A) Bray-Curtis dissimilarity beta diversity of Illumina Miseq metagenomic assemblies (contigs) as calculated by Simka on k-mers of 21 bp, and the (B) percentage of reads mapped from each metagenomic sample (indicated by month of sampling) to assemblies (i.e., contigs) made from their corresponding sample month. Additionally, an assembly from all reads combined (i.e., all metagenomic samples) was produced and reads from each individual month were mapped back to the said assembled contigs (denoted by “All” and highlighted in green).

