Figure 1.
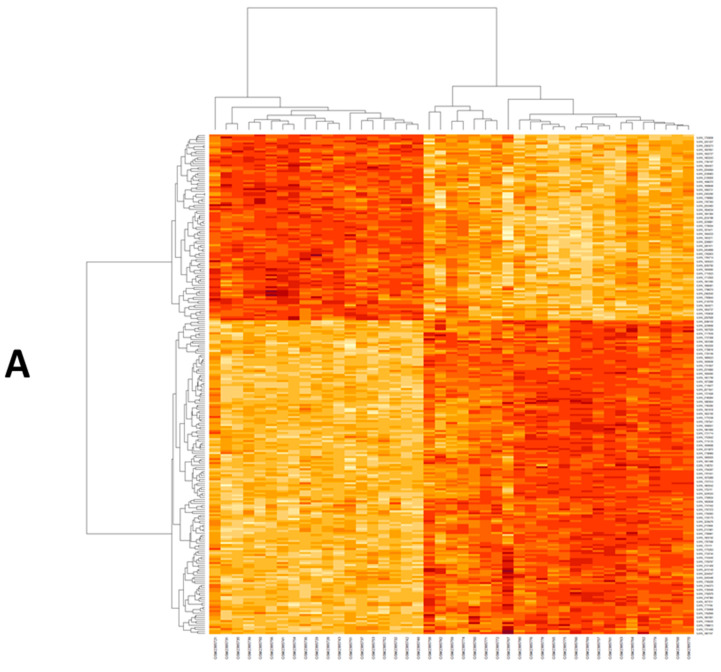
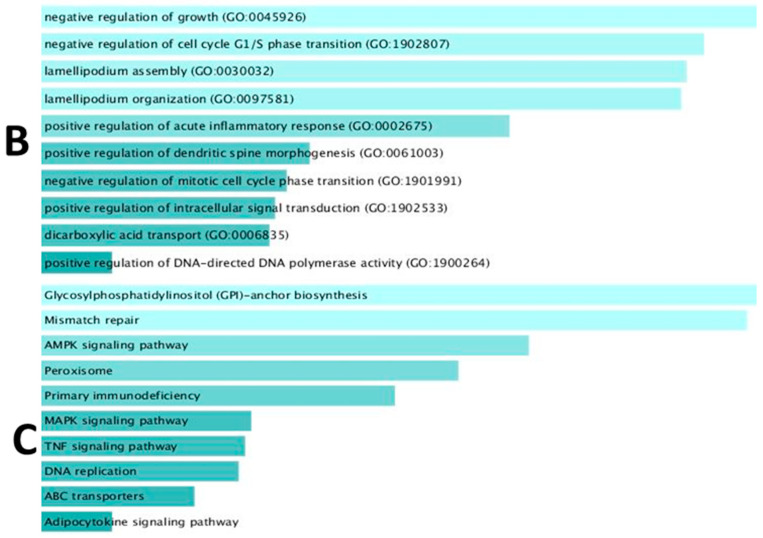
(A) Heat map of differentially expressed genes in GSE89632. The co-expression matrix was represented by a heatmap graphed by heatmap R (Version 3.6.3) built function. Beige color represents down regulation while brick-red color represents upregulation. (B) Top 10 items of Gene Ontology (Biological processes) for the retrieved DEGs according to p value obtained from Enrichr. (C) Top 10 items of KEGG pathways for the retrieved DEGs according to adjust p value obtained from Enrichr.


