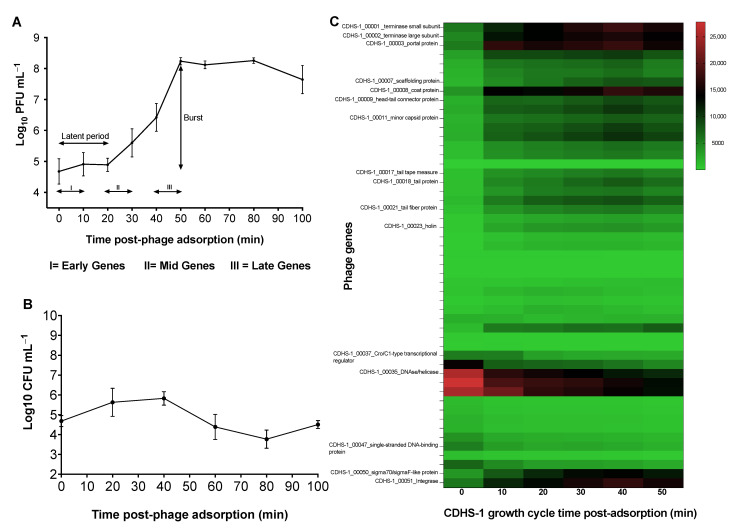
Figure 1.
One-step growth of CDHS-1 and phage genes expressed during infection of C. difficile R20291 at a MOI of 10. (A) One step growth curve of phage CDHS1-1 carried out for 100 min at regular 10 min intervals. Phages showed a latent period starting at 0 min time and ended at 20 min, a log phase from 20 min to 50 min followed by a plateau phase from 50–70 min till experiment was terminated at the decline phase at 80−100 min. (B) Growth response of R20291 during CDHS-1 infection. (C) Heat map showing phage CDHS-1 confirmed functional genes expressed during the I(early, 0–10 min), II(mid-log, 20–30 min), and III(late, 40–50 min) phases of phage replication as analysed by RNA-seq. Graphs were plotted using GraphPad Prism 9 (GraphPad Software, Inc., San Diego, CA, USA).

