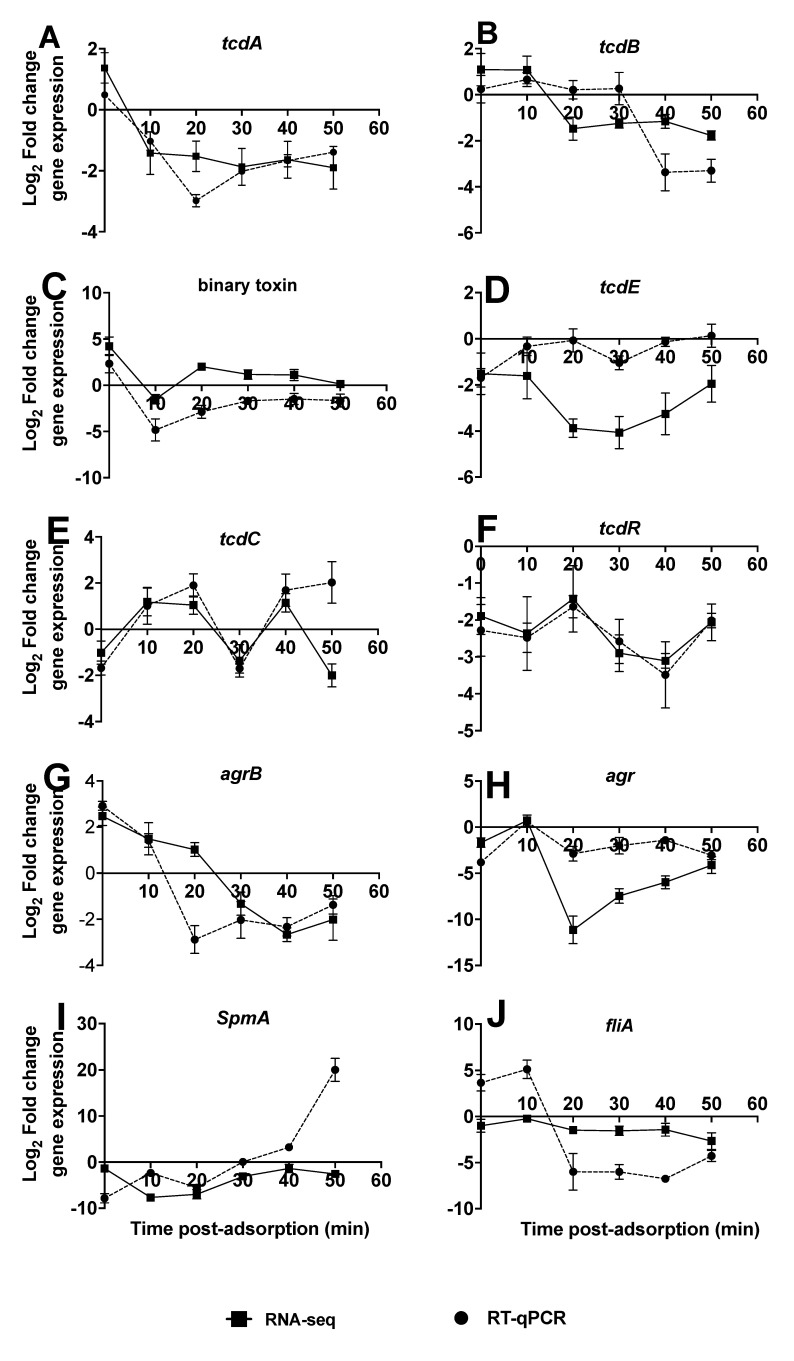
Figure 2.
Comparison of ten selected C. difficile virulence genes at each time points during infection as ascertained by the RNA-seq and RT-qPCR data. The expression profiles are presented as relative expression in relation to the R20291 uninfected phage control (A–J). The data show triplicate of 5 independent biological samples (3 replicate samples for phage-treated and 2 for bacterial control), error bars indicate SEM, Graphs were plotted using GraphPad Prism 9.

