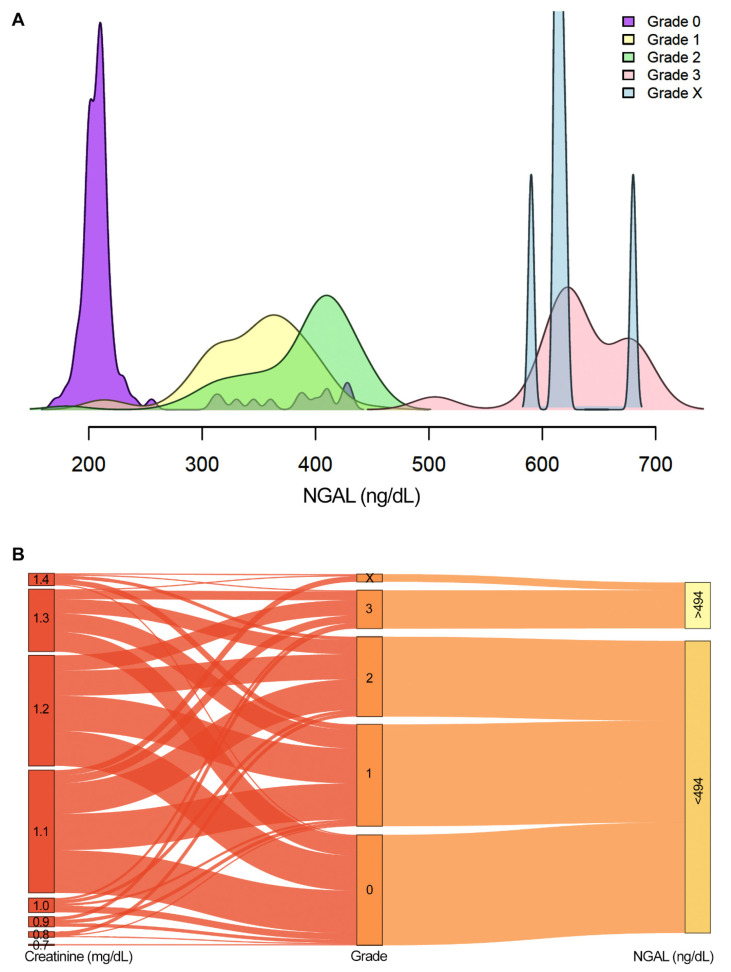
Figure 3.
NGAL levels measured upon admission in different grades. (A) Smoothed density plots of the NGAL levels of the study population measured upon admission for different grades. Negligible overlap was observed in the NGAL values of grades 3 and X with other grades. (B) Sankey plot illustrates the association between serum creatinine levels at 0 h with NGAL levels measured at the same time point in different grades. All patients in grades 3 and X had more than 494 ng/dL of NGAL upon admission, while their creatinine levels at time 0 did not align with the grade classification at 48 h. The association between creatinine values at 48 h and NGAL was analysed using a linear model and adjusted for gender, age, clinical symptoms, and time to antivenom.

