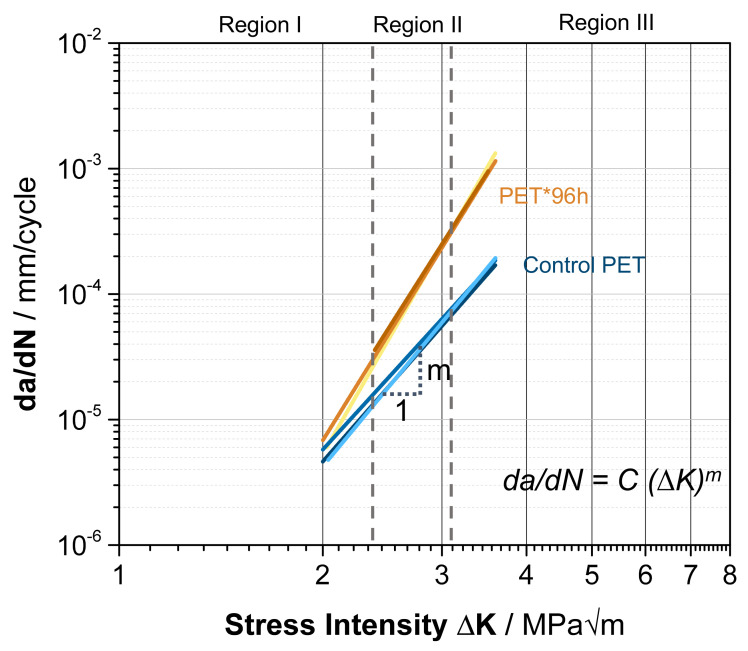
Figure 8.
Power function fit of the FCP data on the linear range in region II in a double logarithmic scale with curves for the PET control (light blue, blue, dark blue) and PET*96 h (yellow, orange, dark orange). The averaged parameters for the fit are mb = 5.5 ± 1.1, Cb = 10–7.9 ± 0.5 for the PET control samples, and me = 10.2 ± 1.4, Ce = 10–8.4 ± 0.6 for PET*96 h.

