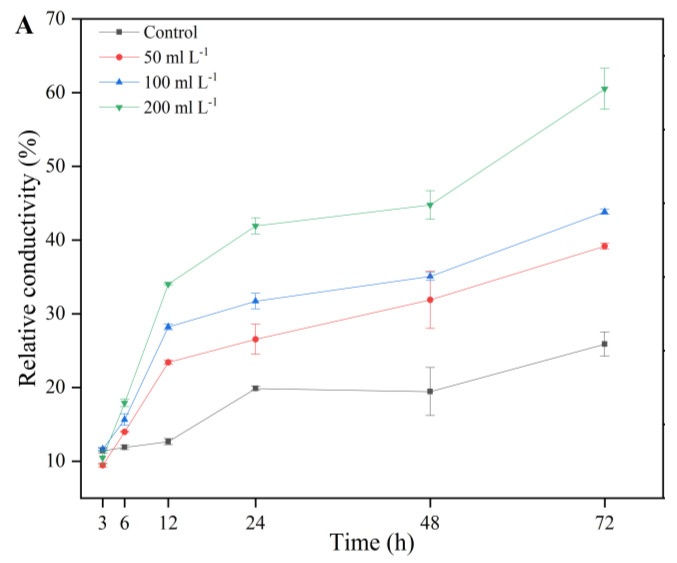
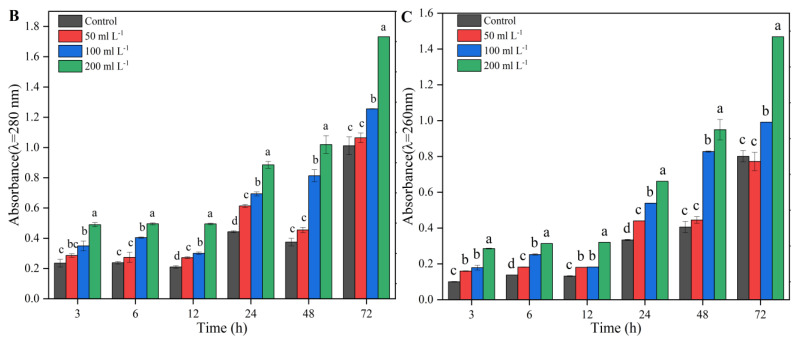
Figure 10.
Detection of relative conductivity (A), nucleic acids leakage (B), and proteins leakage (C) in A. alternata cultures after treatment with 50 mL L−1, 100 mL L−1, and 200 mL L−1 aseptic filtrate for 3 h, 6 h, 12 h, 24 h, 48 h, and 72 h. Data are displayed as the mean ± SE. Bars with the same lowercase letters indicate no significant difference between treatments (p < 0.05).


