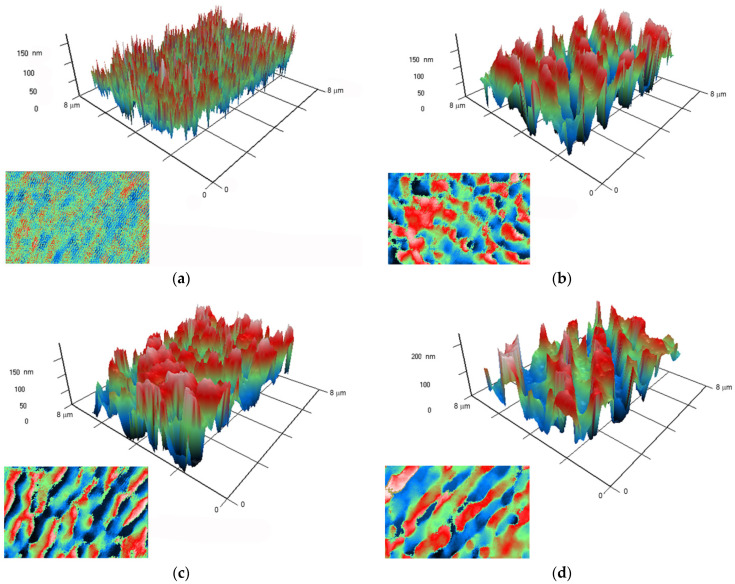
Figure 6.
Images obtained on polymer without nanoparticles (a), and polymers with Ag2O nanoparticles at concentrations of 0.001% (b), 0.01% (c), and 0.1% (d), using a ja. A 3D reconstruction of the surface profile of a polymer and composites based on it is presented. The X and Y axes show the actual size of the investigated surface in micrometers. The Z-axis shows the surface relief as a phase change expressed in nm. The surface elevation map is in left lower part in each picture.

