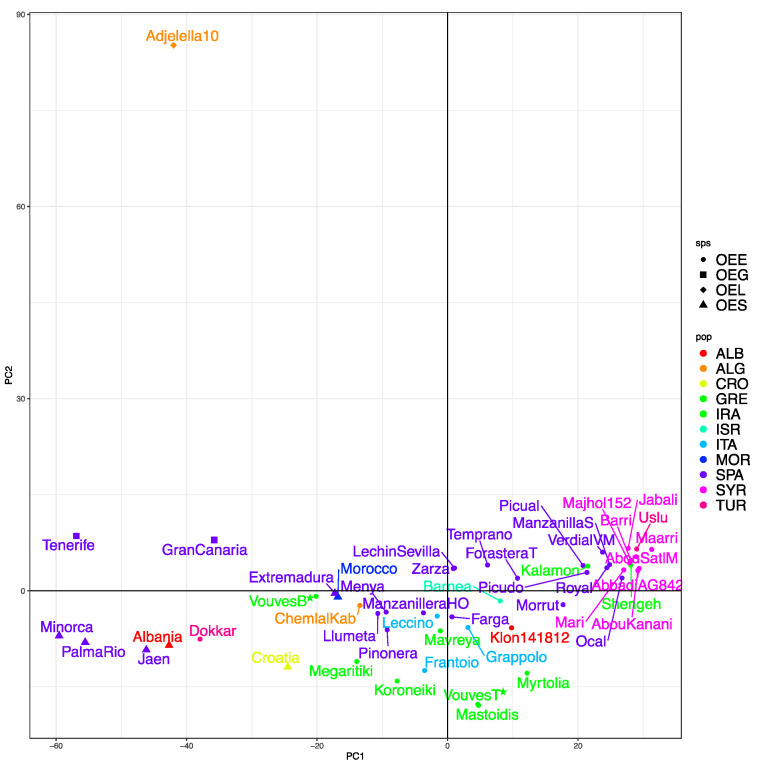
Figure 3.
Principal Component Analysis (PCA) of the distance matrix of the different varieties used in this study. PC1 represents 18.77% of the variance and PC2 5.46%. Subspecies is encoded with the shape of the point (OEL, a diamond, for Olea europaea subsp. laperrinei; OEG, a square, Olea europaea subsp. guanchica; OES, a triangle, Olea europaea var. sylvestris and OEE, a circle, Olea europaea subsp. europaea) while country of origin is encoded with different colors (ALB (red), Albania; ALG (orange), Algeria; CRO (yellow), Croatia; GRE (light green), Greece; IRA (green), Iran; ISR (green-blue), Israel; ITA (light blue), Italy; MOR (blue), Morocco; SPA (purple), Spain; SYR (light purple), Syria and TUR (pink), Turkey). Samples of interest (Vouves bottom and top) have been marked with a star.

