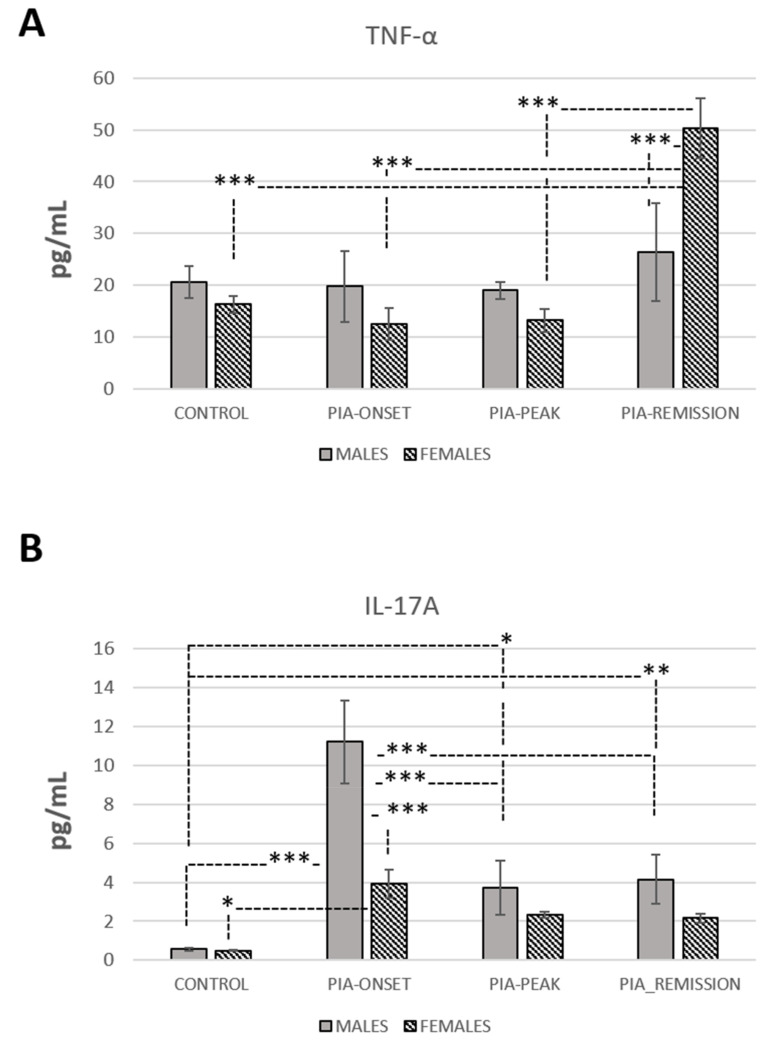
Figure 5.
Expression profiles of TNF-α and IL-17A in serum during PIA. (A) Expression profile of TNF-α in serum. (B) Expression profile of IL-17A in serum. Both profiles are evaluated with ELISA in serum from male and female DA rats: control (treated with saline); PIA onset (between 9th and 12th day after induction); PIA peak (between 16th and 20th day after induction); PIA remission (between 20th and 25th day after induction). Values in pg/mL are expressed as mean ± SD (10 rats/group, N = 40). One-way ANOVA followed by the post hoc Scheffé test: * p < 0.05, ** p < 0.01, and *** p < 0.001.

