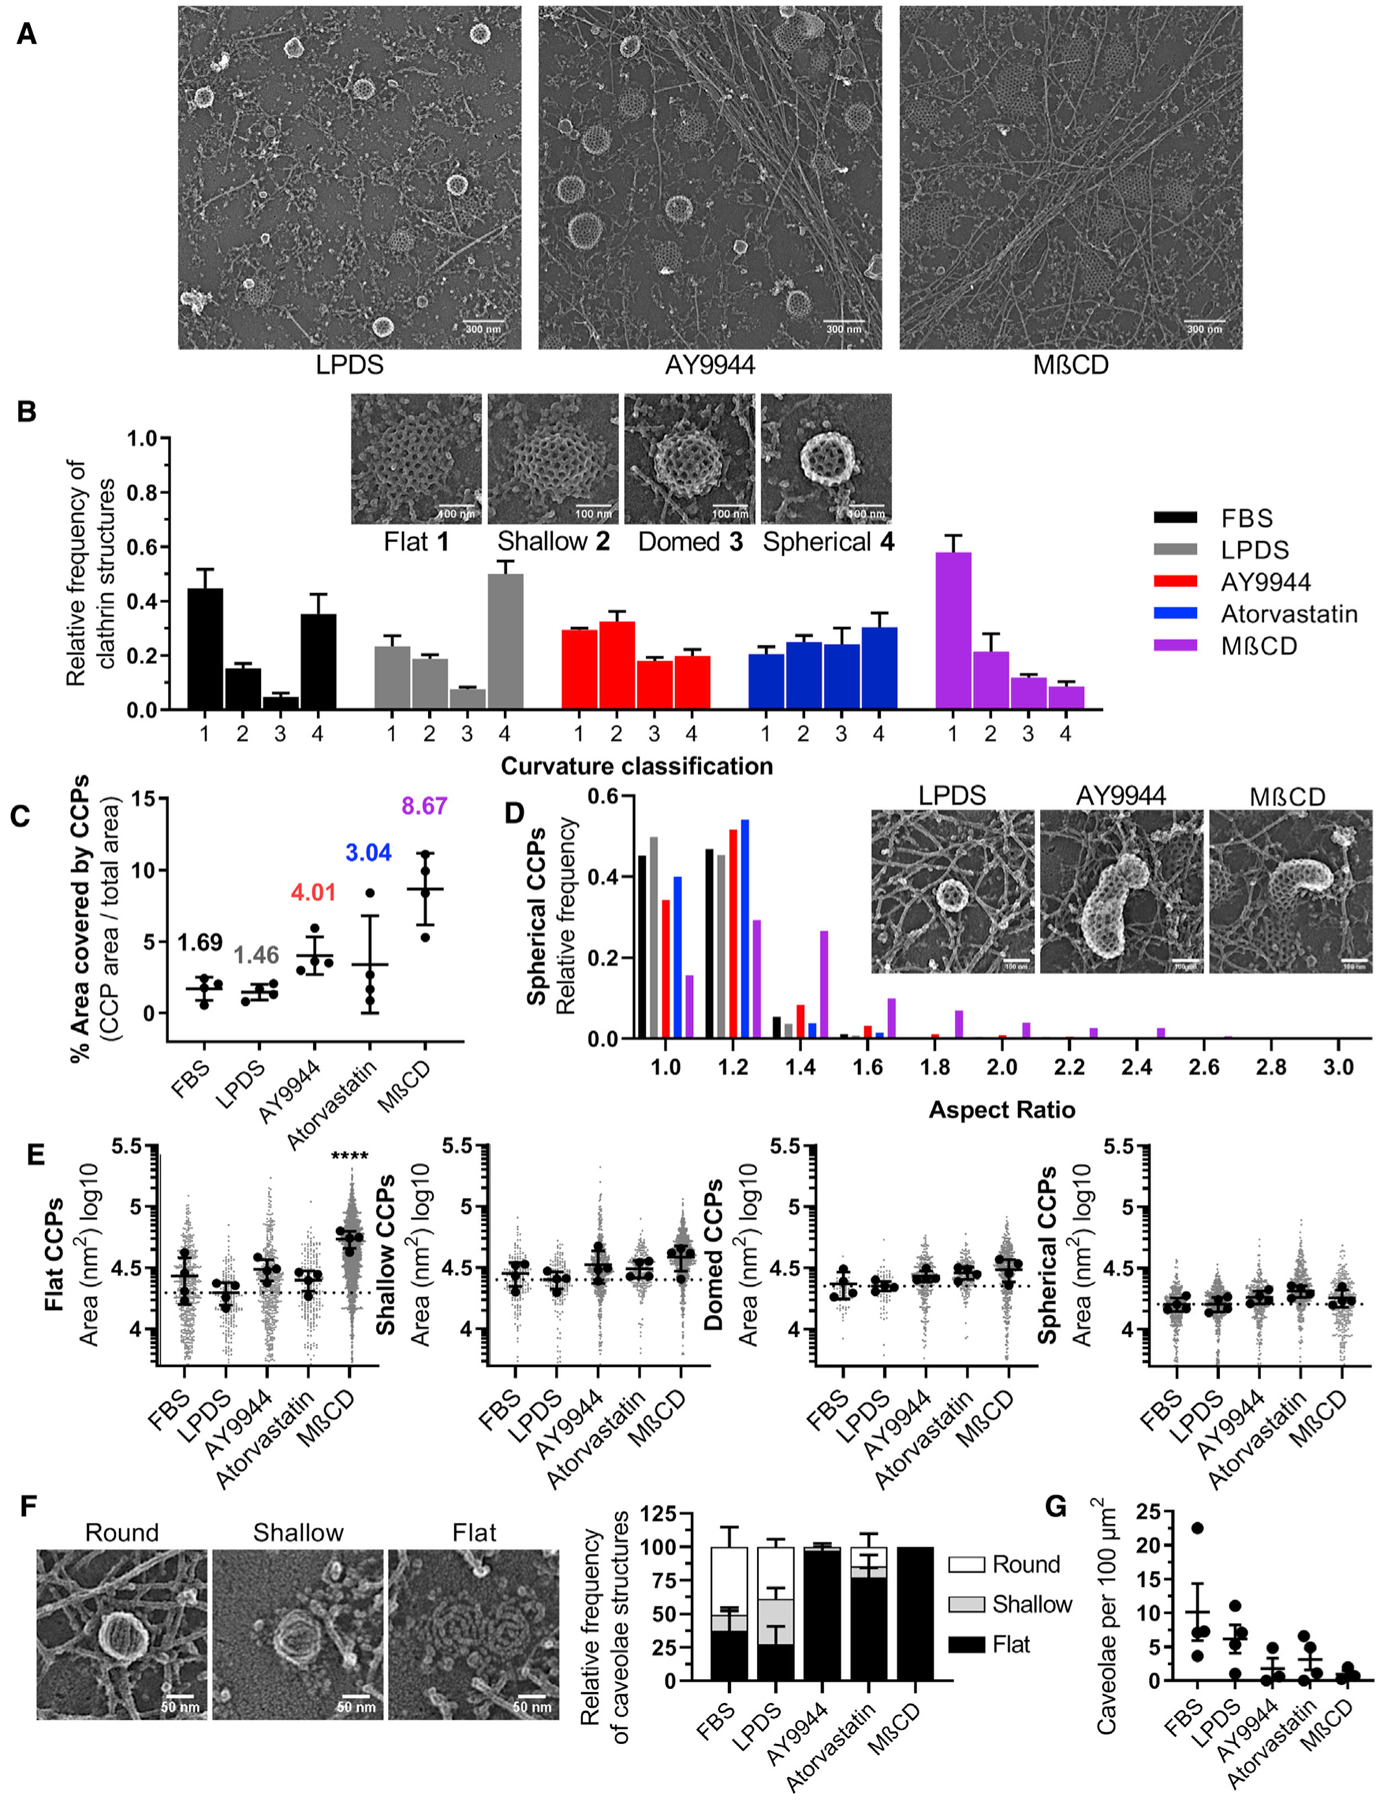
Figure 4. Aberrant clathrin-coated pit ultrastructure under conditions of sterol depletion.

(A) Representative platinum-replica transmission electron microscopy (TEM) images from LPDS, AY9944-treated, and MβCD-treated cells.
(B) Relative frequency of clathrin structures by curvature classification (mean ± SEM).
(C) Area of unroofed cells covered by clathrin structures (mean ± SD).
(D) Histogram of spherical clathrin structures showing the distribution of coated pit asymmetry by aspect ratio (major/minor width).
(E) Average area of clathrin-coated structures by curvature classification relative to LPDS controls (mean ± SD). One-way ANOVA (F(4,15) = 12.91, p < 0.0001) and Dunnett’s test versus LPDS control. n = 4 replicas per condition from 2 independent experiments. Total number of clathrin structures analyzed are as follows: FBS = 1164; LPDS = 988; AY9944 = 1700; atorvastatin = 1003; MβCD = 3818.
(F) Representative platinum-replica TEM images of caveolae ultrastructure and relative frequency of structures by curvature classification (mean ± SEM).
(G) Total number of caveolae structures on the membrane per area (mean ± SEM). n = 3–4 replicas per condition from 2 independent experiments. Total number of caveolae structures analyzed are as follows: FBS = 171; LPDS = 89; AY9944 = 21; atorvastatin = 31; MβCD = 13.
