
Figure 6. CME dynamics are inhibited within Smith-Lemli-Opitz-syndrome-patient-derived fibroblasts.
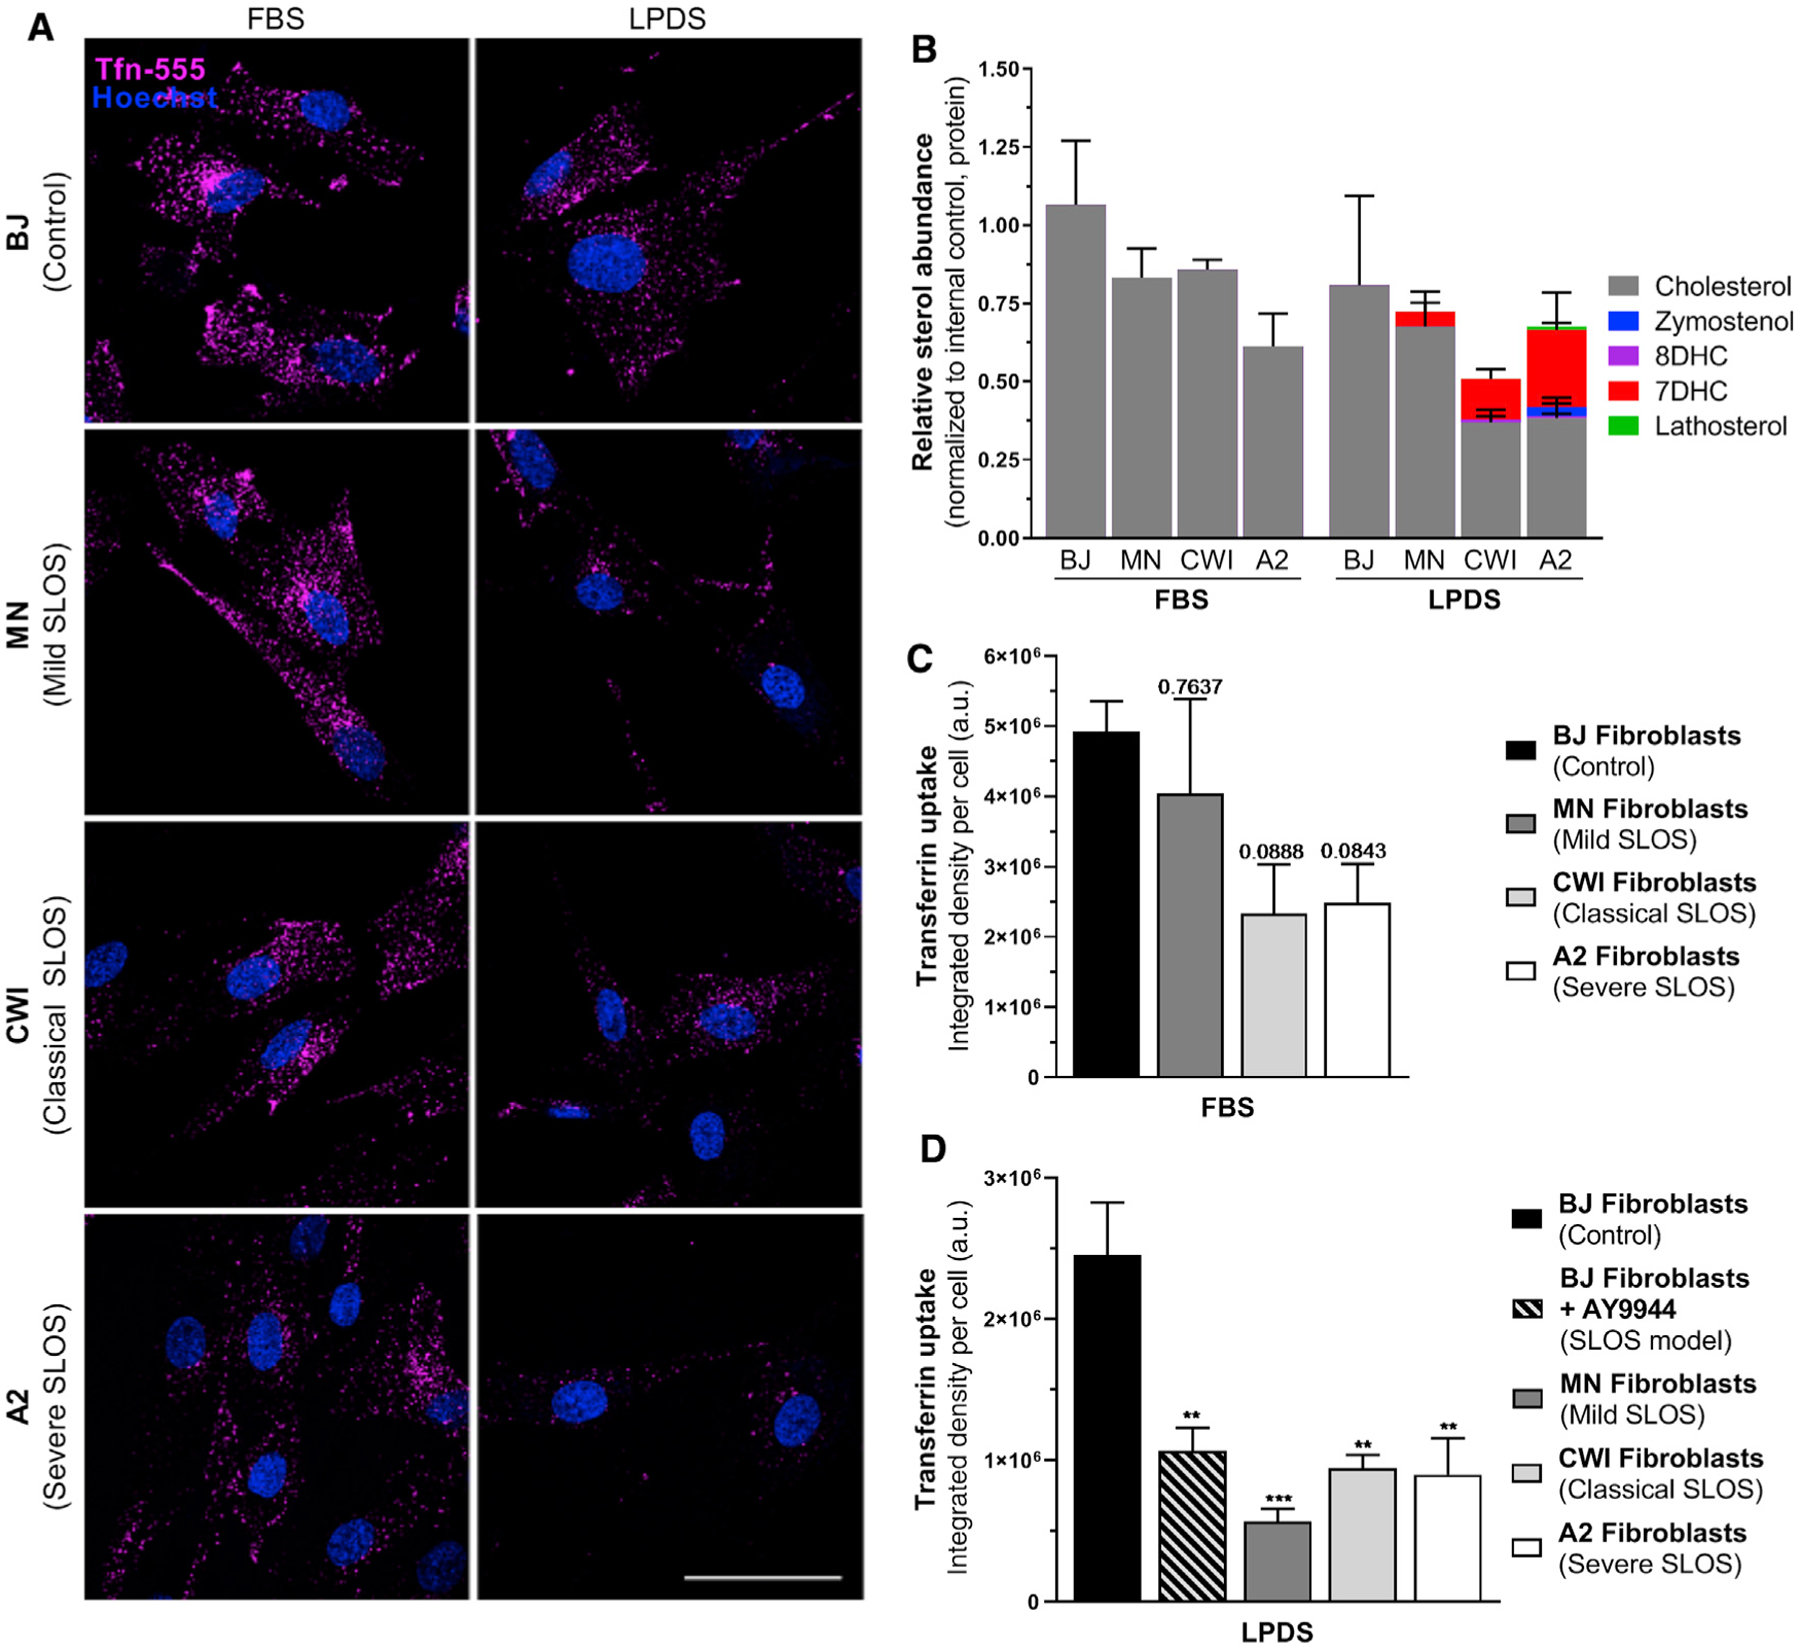
(A) Representative images of AF-555-conjugated Tfn uptake in control and SLOS fibroblasts grown in FBS or LPDS. Scale bar, 50 μm.
(B) Validation of fibroblast biochemistry by GC-MS.
(C) Tfn uptake in FBS relative to unaffected BJ fibroblasts (mean ± SEM). Adjusted p values, one-way ANOVA (F(3,10) = 2.916, p = 0.0869) and Dunnett’s test versus BJ control (n = 3–4 independent replicates, 25 cells per replicate).
(D) Tfn uptake in LPDS relative to unaffected BJ fibroblasts (Mean ± SEM). One-way ANOVA (F(4,13) = 9.464, p = 0.0008) and Dunnett’s test versus BJ control (n = 2–4 independent replicates, 25 cells per replicate).