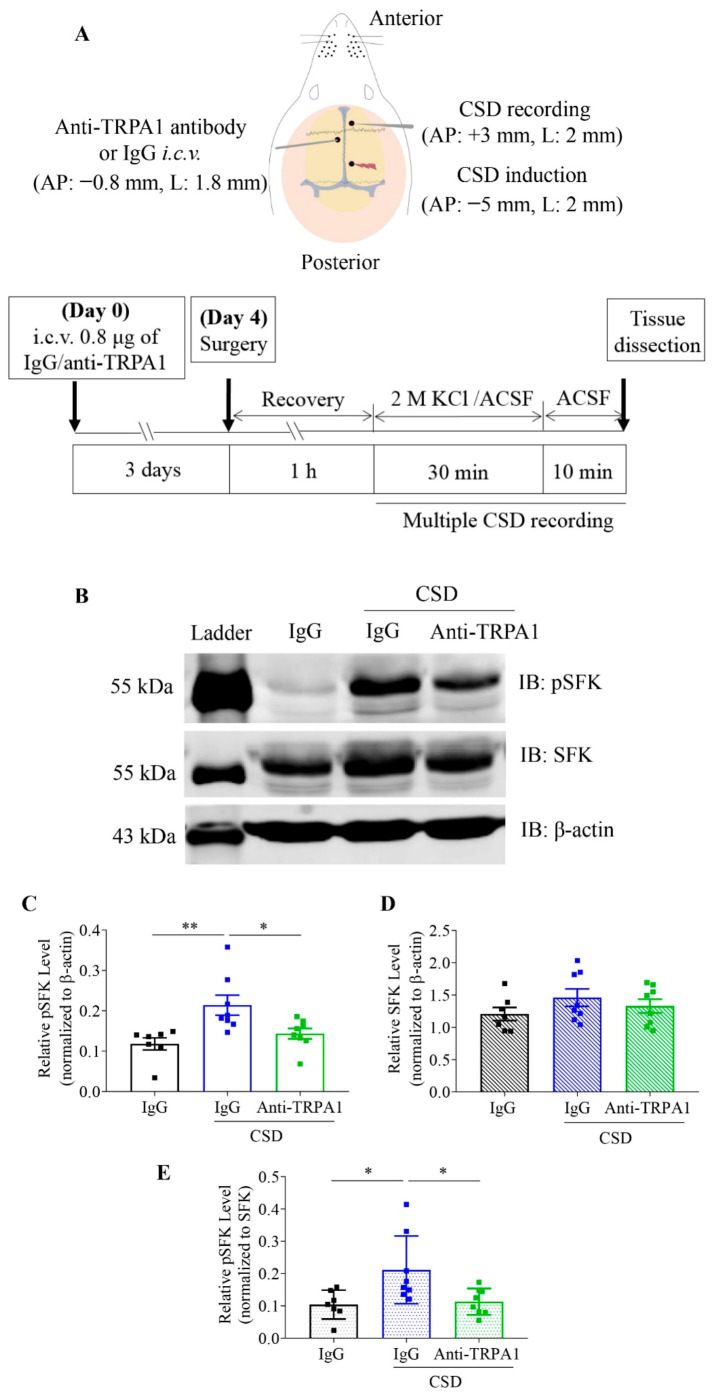
Figure 2.
Anti-TRPA1 antibody reduced phosphorylation of SFKs at Y416 induced by multiple CSD in cytosols of rat cerebral cortices. (A) Diagram showing brain coordinates for CSD induction, CSD recording and drug perfusion (Upper) as well as the in vivo experimental procedure (lower). (B) Representative images showing Western blot analysis of expression of phosphorylated SFKs (pSFKs) at Y416, SFKs and β-actin in cytosolic cerebral cortices of rats treated with IgG or anti-TRPA1 antibody (Anti-TRPA1) at 0.8 μg with or without 2 M K+-induced CSD. (C,D) Data analysis of the levels of phosphorylated SFKs at Y416 or SFKs relative to that of β-actin (absolute ratio in band intensity) and (E) comparison of relative pSFK normalized to SFK levels (absolute ratio in band intensity) in cytosolic cerebral cortices of rats treated with IgG without CSD induction (n = 7), IgG with CSD induction (n = 8) or anti-TRPA1 antibody with CSD induction (n = 8). Group data were presented as mean ± SEM. Two-tailed unpaired t-test was used for comparison between IgG without CSD and IgG with CSD group, IgG with CSD and anti-TRPA1 antibody with CSD group. Significance differences were shown as * p < 0.05, ** p < 0.01.

