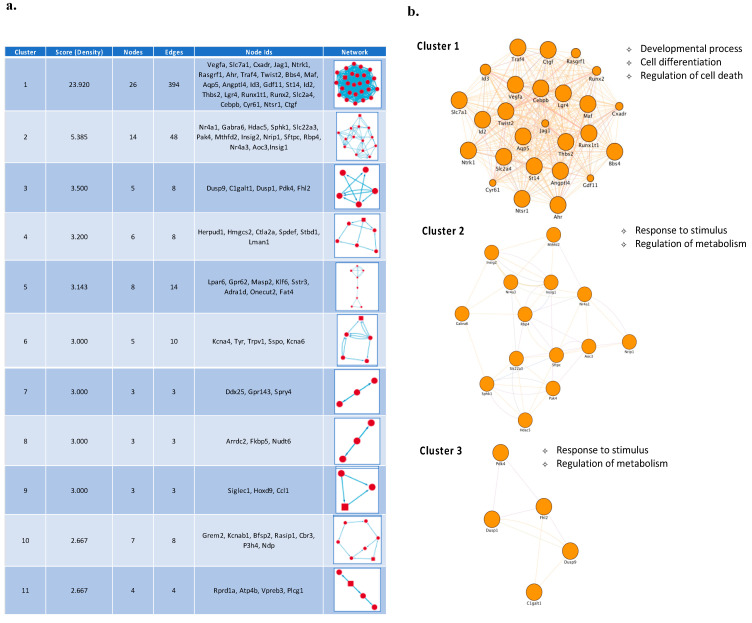
Figure 5.
PPI network cluster analysis. (a) Sub-network analysis in the PPI network using MCODE identified 11 significant modules/clusters Cluster analysis in the PPI network resulted in 7 clusters, which include 72 nodes and 276 edges, and are enriched for several biological process GO terms. (b) Cluster 1, Cluster 2 and Cluster 3 of the top three network clusters in the sub-network analysis of PPI networks of core set genes. These clusters had the highest scores among the clusters. The cluster networks were visualized by Cytoscape by mapping the “degree parameter” to node size.

