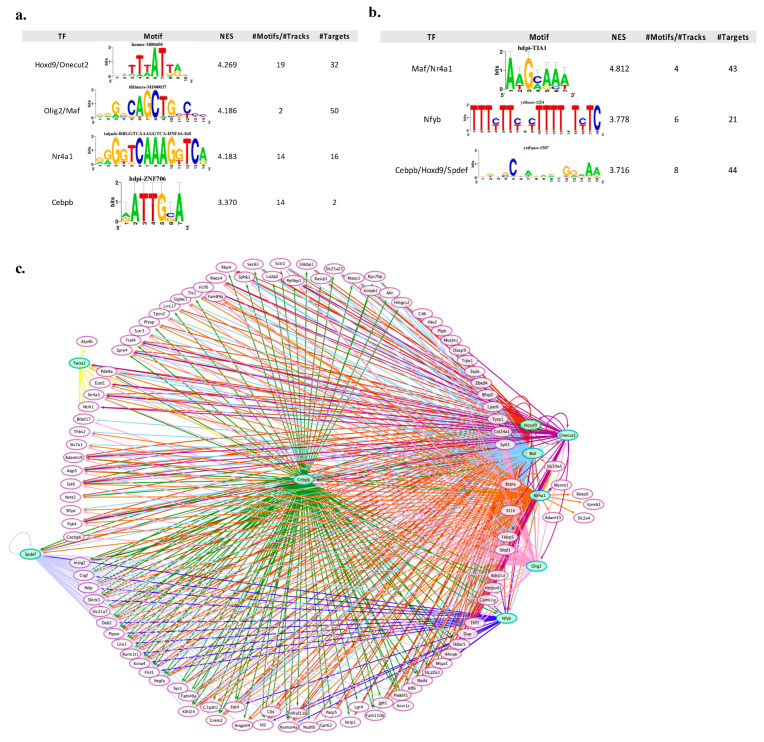
Figure 6.
The upstream regulatory network is predicted to regulate the expression of the survival-related gene signatures in CGNs. (a) Result summary of the regulatory analysis with iRegulon on up-regulated core set genes. (b) Result summary of the regulatory analysis with iRegulon on downregulated core set genes. In particular, the top transcription binding motifs and their associated transcription factors (filtered for TF differentially expressed in our analysis) are shown. (c) The whole overview of the regulatory network of 9 key TFs together with their core set candidate targets. The network was visualized by Cytoscape. Targets are in white circle nodes with purple borders and TF in green hexagon nodes. Regulons for each TF are represented by different edge colors.

