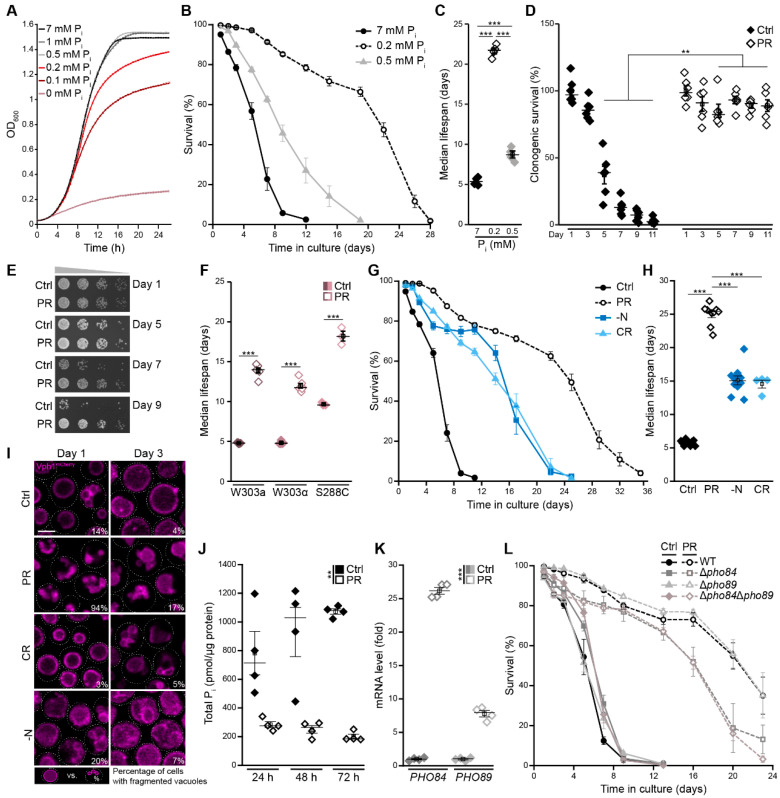
Figure 1.
Phosphate restriction induces longevity. (A) Growth curves of wild type (WT; BY4742) cells on synthetic minimal glucose media with indicated phosphate (Pi) concentrations. OD600 was recorded every 30 min using a BioscreenC microplate reader; n = 8. (B,C) Survival during chronological aging and (B) and corresponding median lifespan (C) of WT cells grown in media supplemented with 7 mM, 0.5 mM or 0.2 mM phosphate. Survival was determined by flow cytometric quantification of propidium iodide (PI) staining, indicating loss of membrane integrity and, thus, cell death; n = 4. (D) Clonogenic survival determined via survival plating and quantification of colony-forming units of WT cells grown on standard medium (Ctrl; 7 mM phosphate) or phosphate-restricted medium (PR; 0.2 mM phosphate). Survival was determined at indicated time points during chronological aging; n = 6. (E) Serial dilution spotting assays as a measure of regrowth capability of WT cells grown on Ctrl or PR media for indicated days. (F) Median lifespan of wild type yeast cells with different genetic backgrounds (W303a, W303α, and S288C) grown on Ctrl or PR media; n = 3–6; (G,H) Survival during chronological aging (G) and corresponding median lifespan (H) of WT (BY4742) cells grown under different nutrient conditions: nitrogen starvation (−N), caloric restriction (CR; 0.5% glucose), phosphate restriction (PR) (0.2 mM phosphate) and standard conditions (Ctrl). Survival was determined by flow cytometric quantification of PI staining; n ≥ 4. (I) Representative confocal micrographs of WT cells harboring endogenously mCherry-tagged Vph1 to visualize vacuoles grown for 1 day or 3 days under nutrient conditions shown in (G). Mean percentages of cells with multiple vacuoles are indicated (n = 4, with ≥42 cells per n and n = 4). Scale bar represents 3 µm. (J) Relative levels of total phosphate (Pi) in WT cells grown for 24 h, 48 h and 72 h on standard or PR medium; n = 4. (K) The quantification of PHO84 and PHO89 mRNA levels via RT-qPCR in WT cells grown for 24 h on standard or PR medium. The comparative CT method (∆∆CT method) was used to calculate the relative gene expression using UBC6 as housekeeping gene; n = 4. (L) Survival during chronological aging of WT, ∆pho84, ∆pho89 and ∆pho84∆pho89 cells on Ctrl or PR media. Survival was determined by flow cytometric quantification of PI staining; n = 4. For statistical analysis, one-way ANOVA followed by Tukey post hoc for multiple comparisons (C,F,H), two-way ANOVA (D,J) or Welch–ANOVA (K) were used. ** p < 0.01 and *** p < 0.001.

