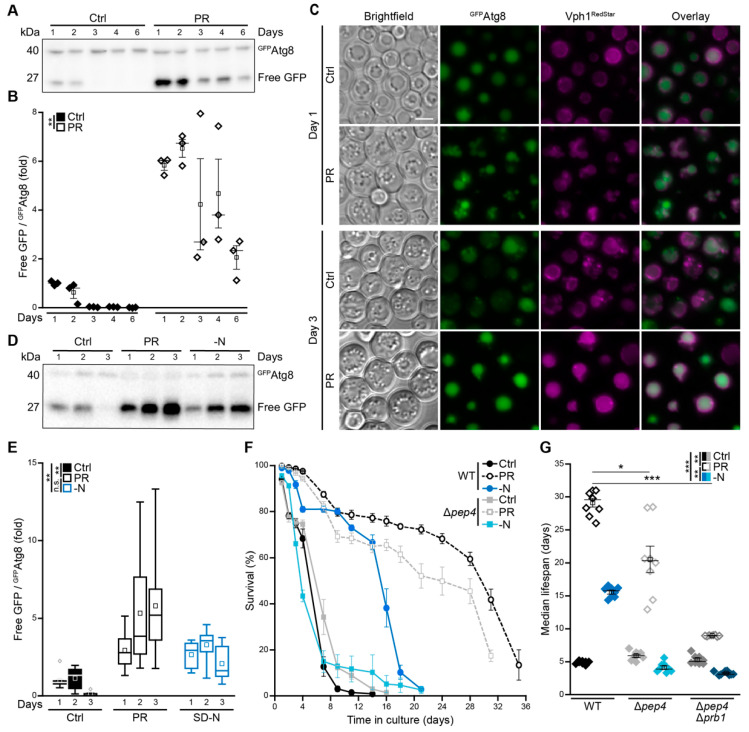
Figure 3.
Phosphate exhaustion results in a strong induction of autophagy. (A,B) Immunoblot analysis (A) and corresponding densitometric quantification (B) of GFPAtg8 processing in protein extracts from WT cells harboring endogenously GFP-tagged Atg8 grown in standard (Ctrl) or phosphate-restriction (PR) media. Blots were probed with antibodies directed against GFP, and the ratio free GFP/GFPAtg8, indicative of autophagic flux, is depicted; n = 3. (C) Microscopic analysis of WT cells endogenously expressing GFPAtg8, as well as Vph1RedStar, to visualize vacuoles grown for 1 or 3 days on Ctrl or PR media. Scale bar represents 3 µm. (D,E) Immunoblot analysis (D) and corresponding densitometric quantification (E) of GFPAtg8 processing in protein extracts from WT cells harboring GFP-tagged Atg8 subjected to phosphate restriction (PR), nitrogen starvation (−N) or standard conditions (Ctrl). Blots were probed with antibodies directed against GFP, and the ratio free GFP/GFPAtg8, indicative of autophagic flux, is depicted; n = 8. (F) Survival during chronological aging of WT and ∆pep4 cells grown on Ctrl, PR or −N medium. Cell death was determined via flow cytometric analysis of PI staining; n ≥ 4. (G) Median lifespan of cells shown in (F) including ∆pep4∆prb1 cells; n = 8. For statistical analysis, two-way ANOVA (B,E) and Welch–ANOVA (G) were used. * p < 0.05, ** p < 0.01 and *** p < 0.001; ns not significant.

