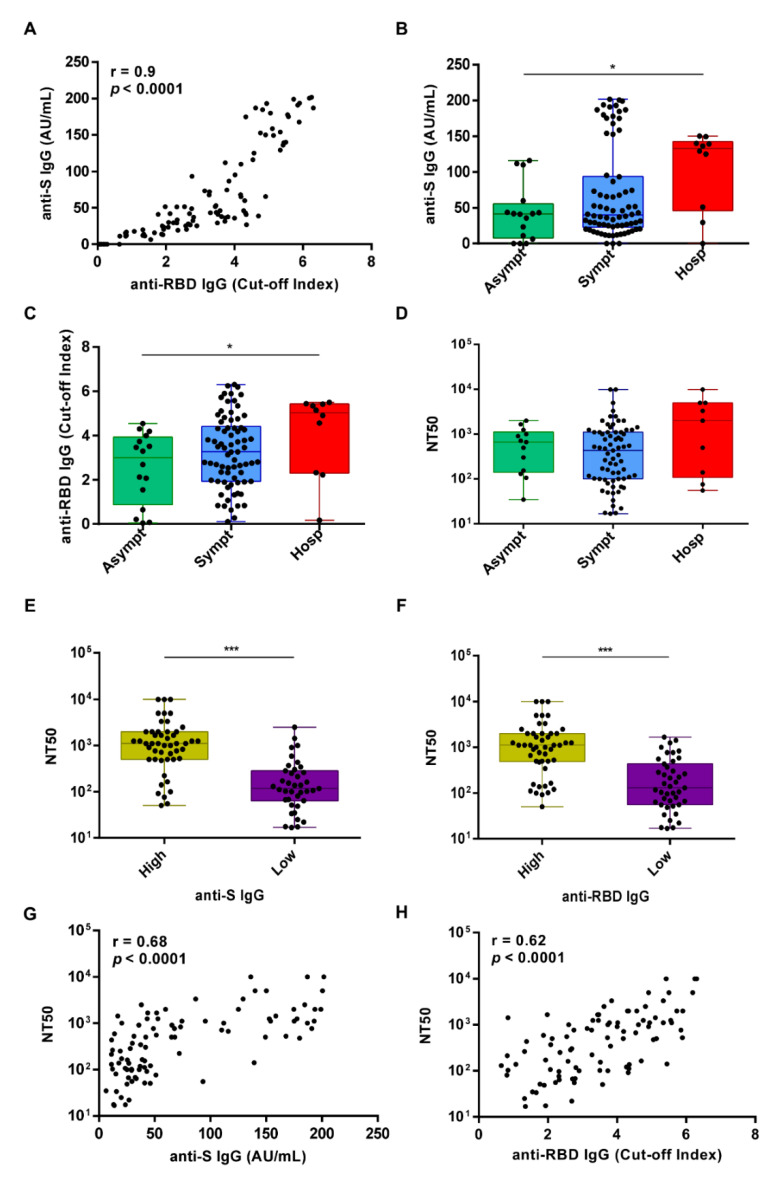
Figure 2.
Antibody responses in the study cohort following SARS-CoV-2 infection at 1.5 months (M2) after the first positive PCR test. (A) Spearman’s correlation between anti-S IgG AU/mL and anti-RBD IgG cut-off index as assessed by ELISA at M2. (B–D) The 100 study subjects were categorized into 3 groups according to disease severity (asymptomatic n = 16, symptomatic n = 74, or hospitalized n = 10) and plotted according to anti-S IgG AU/mL (B) or anti-RBD IgG cut-off index (C) and the neutralization titer expressed as NT50 (D). Solid circles indicate individual values. The p-value among different groups was calculated by Kruskal–Wallis test * p < 0.05. (E) Box plot distribution of the neutralizing activity expressed as NT50 in the group of high or low anti-S IgG levels—above and below the median, respectively. (F) Box plot distribution of the neutralizing activity expressed as NT50 in the group of high or low anti-RBD IgG levels—above and below the median, respectively. In E and F, the solid circles indicate individual values. p-values were determined by two-sided Mann-Whitney test. *** p < 0.001. (G) Spearman correlation between the neutralization titer expressed as NT50 and the anti-S IgG levels. (H) Spearman correlation between the neutralization titer expressed as NT50 and the anti-RBD IgG levels.

