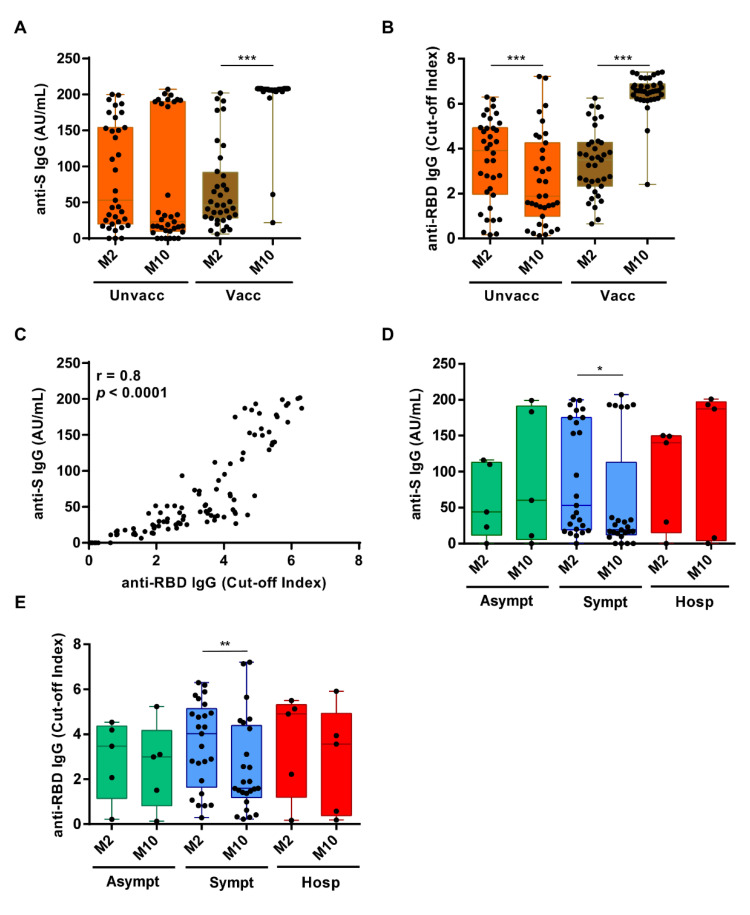
Figure 3.
Dynamic changes in anti-S and anti-RBD IgG levels between M2 and M10 after the first PCR-positive test. (A) Box plot distribution of anti-S IgG levels or (B) anti-RBD IgG levels in unvaccinated (left) or vaccinated (right) subjects at M2 vs. M10. Solid circles indicate individual values. p-values were calculated by two-sided Wilcoxon signed-rank tests. *** p < 0.001. (C) Spearman correlation between anti-S IgG AU/mL and anti-RBD IgG cut-off index as assessed by ELISA at M10. (D) Comparison of anti-S IgG levels between asymptomatic (n = 16), symptomatic (n = 74), or hospitalized (n = 10) subjects at M2 and M10. p-values were calculated by two-sided Wilcoxon signed-rank tests. * p < 0.05. (E) Comparison of anti-RBD cut-off index between asymptomatic n = 16, symptomatic n = 74, or hospitalized n = 10 subjects at M2 or M10. p-values were calculated by two-sided Wilcoxon signed-rank test. ** p < 0.01.

