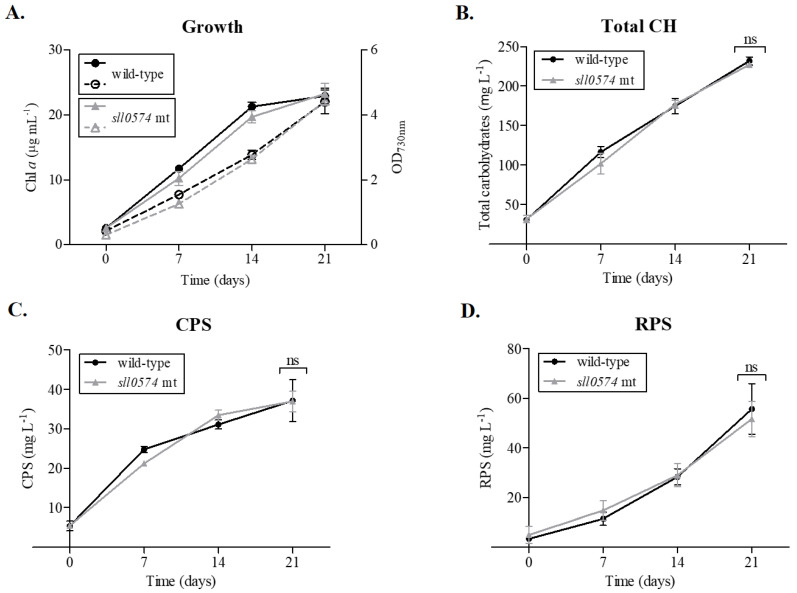
Figure 3.
Growth curves and carbohydrate production by Synechocystis sp. PCC 6803 wild-type and the kpsM sll0574 mutant (sll0574 mt). Growth was monitored by measuring the optical density at 730 nm (full lines) and chlorophyll a (Chl a) (dashed lines) (A). Total carbohydrates (Total CH) (B), capsular polysaccharides (CPS) (C), and released polysaccharides (RPS) (D) were measured by the phenol-sulphuric acid method [24] and expressed as milligrams per liter of culture. Cells were grown in BG11 medium at 30 °C under a 12 h light (50 µE m−2 s−1)/12 h dark regimen, with orbital shaking at 150 rpm. Experiments were performed in triplicate, and statistical analysis is presented for the final time point (ns: not significant; p-value > 0.05).

