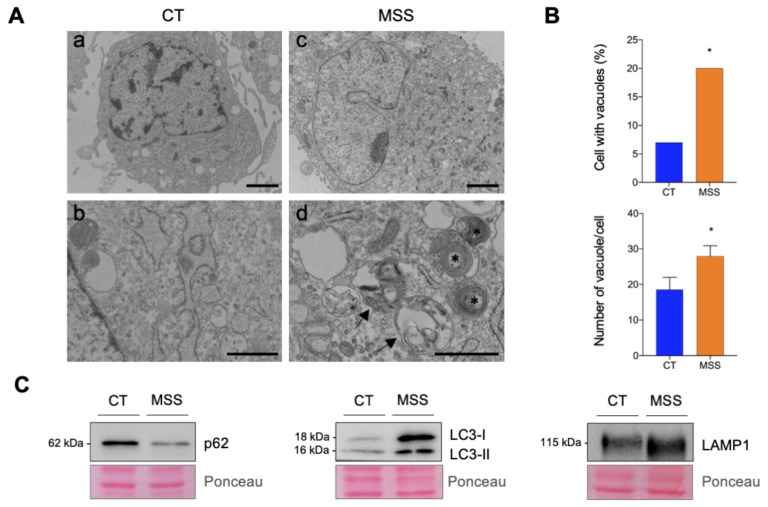
Figure 3.
Electron microscopy (EM) and immunoblot analysis of autophagic vacuoles. (A) Ultrastructural alterations in HF-MSS. Representative EM micrographs of HF-CT (a) and HF-MSS (c) cells. Details at higher magnification of the cytoplasm of HF-CT (b) and HF-MSS (d) cells. HF-MSS cells accumulate vacuoles containing large clusters of membranes (arrowheads) and multilamellar bodies (asterisks). Scale bars: a and c: 2 μm; b and d: 1 μm. (B) Upper graph, percentage of HF-CT and HF-MSS cells exhibiting vacuoles/multilamellar bodies (n = 100 cells/group); lower graph, average number of vacuoles/multilamellar bodies per cell calculated by considering only the cells showing such structures. Statistical significance Chi square test (lower) and t-test (upper) * p < 0.05. (C) HF-CT (CT) and HF-MSS (MSS) cultured under standard growth conditions were analyzed by Western blotting for the expression of p62/SQSTM1 (p62), LC3, and LAMP1. Immunoblots are representative of at least two independent experiments. Ponceau S staining of the blots is shown to control for equal protein loading.

