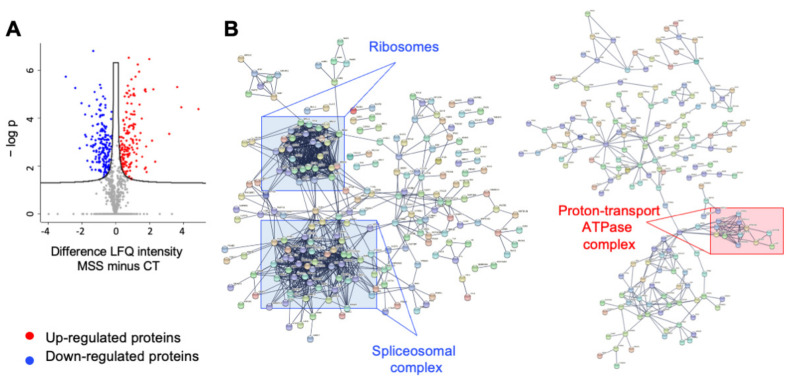
Figure 4.
Proteomic analysis graphical networks. (A) Volcano Plot: Statistical analysis of differentially expressed proteins between HF-CT and HF-MSS cells, run by Perseus. LQF intensity of HF-MSS minus that of HF-CT was plotted against the negative logarithm of the p-values. (B) STRING network of proteins downregulated (left) and upregulated (right) in HF-MSS, confidence level set at 0.9. Squares indicate examples of clusters of interacting proteins involved in the indicated functions.

