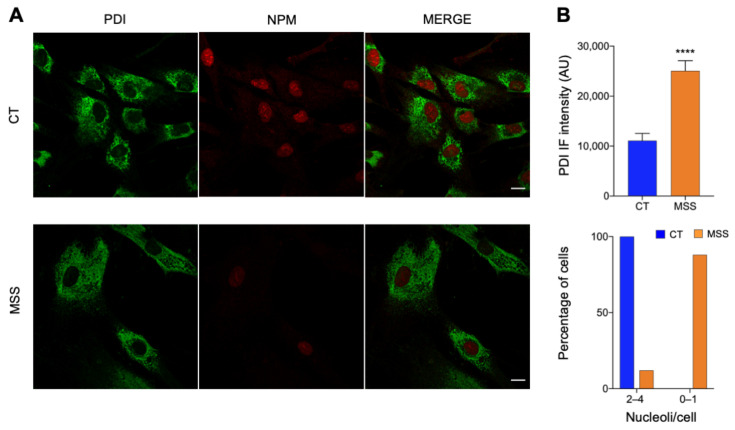
Figure 6.
Fluorescence microscopy validation of proteomic analysis. (A) HF-CT (CT) and HF-MSS (MSS) were plated on glass coverslips, fixed in PFA 4%, and processed for immunofluorescence. Confocal images of cells stained for PDI (green) and NPM (red) are shown. The merge of green and red signal is also shown. Scale bar: 20 µm. (B) Quantification of total PDI staining and the number of NPM-positive nucleoli/cell of the experiment shown in A. Blue and red bars indicate HF-CT and HF-MSS, respectively. **** p < 0.0001.

