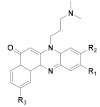
Table 2.
The chemical structures of benzo[a]phenazine derivatives 167–174, IC50 values of in vitro growth inhibitory, relative activity of Topo I-DNA cleavage and Topo II ATPase inhibition.
| Structure/Name | In Vitro Growth Inhibitory a IC50 Values | Relative Activity | |
|---|---|---|---|
| Topo I Cleavage b | Topo II ATPase Inhibition c | ||
 167 R1 = R2= H 168 R1 = H, R2 = OCH3 169 R1 = OCH3, R2= H |
(167): IC50 = 3.99 μM (HeLa), 3.65 μM (A549), 5.01 μM (MCF-7), 1.40 μM (HL-60). | (167): +++ | (167): ++ |
| (168): IC50 = 4.36 μM (HeLa), 5.45 μM (A549), 2.83 μM (MCF-7), 2.36 μM (HL-60). | (168): − | (168): +++ | |
| (169): IC50 = 2.26 μM (HeLa), 2.24 μM (A549), 2.27 μM (MCF-7), 1.04 μM (HL-60). | (169): − | (169): ++ | |
 170 n = 1 171 n = 2 172 n = 3 |
(170): IC50 = 0.31 μM (HL-60), 24.56 μM (K562), 9.91 μM (Hela), 22.31 μM (A549). | (170): Nd. | (170): Nd. |
| (171): IC50 = 0.21 μM (HL-60), 5.93 μM (K562), 8.41 μM (Hela), 13.51 μM (A549). | (171): Nd. | (171): Nd. | |
| (172): IC50 = 0.38 μM (HL-60), 4.73 μM (K562), 21.44 μM (Hela), 16.28 μM (A549). | (172): ++ | (172): ++++ | |
 173 R1 = R2 = H, R3= OCH3 174 R1= H, R2 = R3 = OCH3 |
(173): IC50 = 0.22 μM (HL-60), 7.13 μM (K562), 29.95 μM (Hela), 32.96 μM (A549). | (173): Nd. | (173): ++++ |
| (174): IC50 = 0.09 μM (HL-60), 8.73 μM (K562), 18.23 μM (Hela), 26.45 μM (A549). | (174): Nd. | (174): ++++ | |
a IC50 = concentration required for 50% of the antiproliferative effect for a given cell population grown for 2 days in presence of the compound of interest.; b The relative Topo I cleavage complex stabilizing potencies of the compounds are presented as follows: −, no detectable activity; +, weak activity; ++, weaker activity than that of CPT; +++, activity similar to that of CPT.; c The relative Topo II ATPase inhibitory potencies of the compounds are presented as follows: −, no detectable activity; +, weak activity; ++, weaker activity than that of 1,4-naphthoquinone; +++, activity similar to that of 1,4-naphthoquinone, higher activity than that of 1,4-naphthoquinone; ++++.; Nd = not determined.
