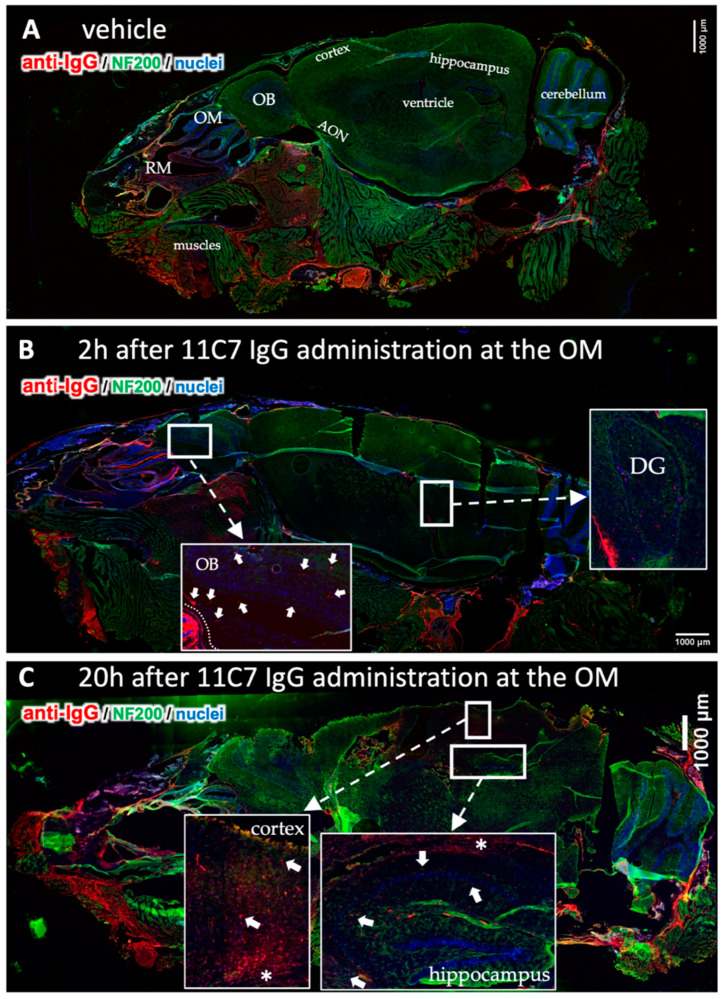
Figure 6.
Time-dependent CNS distribution analyzed in sagittal section from mouse heads after region-specific delivery at the olfactory mucosa (OM, study 3). Whole slide images of a vehicle treated animal demonstrate endogenous IgGs in the nasal mucus, but also in the muscles underneath the nasal cavity and at the neck (A). This immunoreactivity was observed in all animals investigated. No background staining was observed in the CNS except for choroid plexus in all vehicle animals. The 11C7 could clearly be detected in the olfactory bulbs (arrowheads) and in the dentate gyrus of the hippocampus (B). At 20 h after administration the distribution pattern shifted into the caudal direction with lower intensities in the olfactory bulbs, but higher and more distinct staining in the cortex and the hippocampus where the antigen of 11C7 was expressed. Arrowheads point to distinct stained structures while asterisk show diffuse staining pattern. (C). OM, olfactory mucosa; RM, respiratory mucosa; OB, olfactory bulb; AON, anterior olfactory nucleus; DG, dentate gyrus. Scale bars, 1000 µm.

