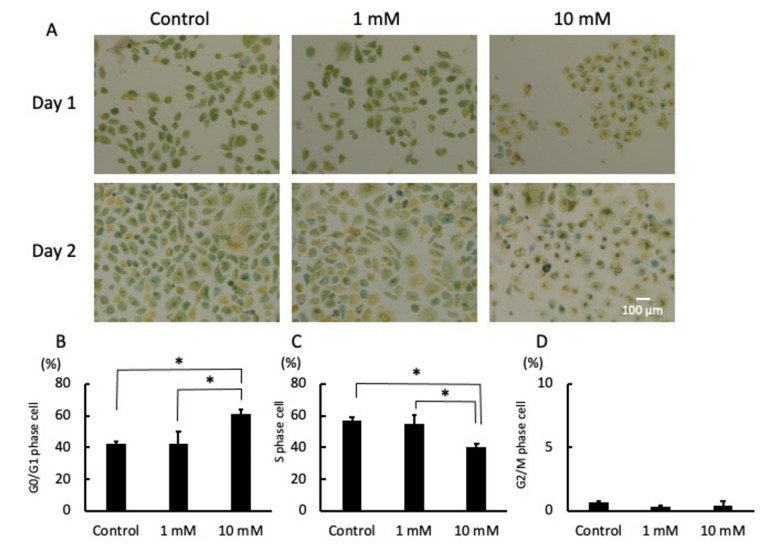
Figure 3.
Photomicrographs of the cell cycle on days 1 and 2 (A). The cells were cultured with fresh medium supplemented with 1 or 10 mM LA or fresh medium only (as a control). Representative photomicrographs of four independent experiments are shown. The phase of the cell cycle was determined by color pixel analysis. The percentages of cells in the G0/G1 phase (B), S phase (C), and G2/M phase (D) are shown. * p < 0.05. Values are presented as the mean ± SD of four independent experiments. Scale bar = 100 µm.

