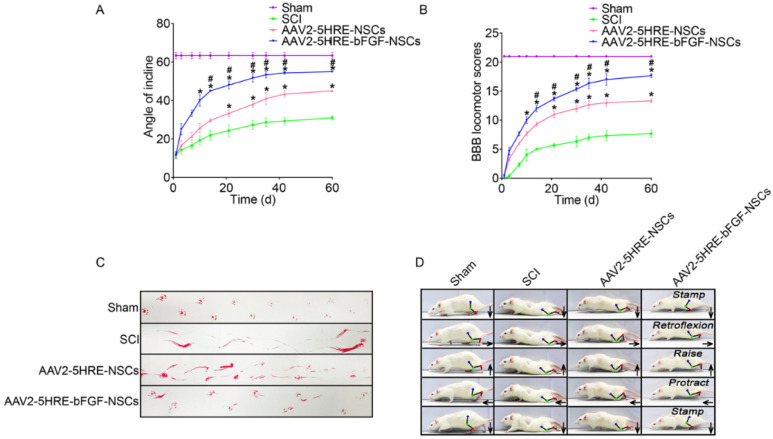
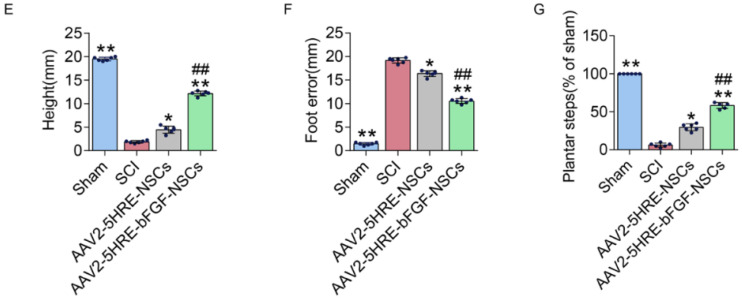
Figure 2.
(A) The inclined plane test scores of sham, SCI group, adeno-associated virus 2-5HRE- neural stem cell (AAV2-5HRE-NSC) group, and AAV2-5HRE-basic FGF-NSC group. (B) The Basso–Beattie–Bresnahan (BBB) scales of sham, SCI group, AAV2-5HRE-NSC group, and AAV2-5HRE-bFGF-NSC group. Data are reported as the mean values ± SEM (n = 3). (C) Footprint examinations of the four studied groups. (D) Video sequences of a rat walking 2 months after SCI. Arrows indicate foot movement. Scale bar = 20 mm. (E) Height of the trunk from the ground reported as weight support, (F) foot error, and (G) plantar step. Data are reported as the mean values ± SEM (n = 6). # attributed to the p < 0.05, AAV2-5HRE-NSCs group verse SCI group, * is attributed to the p < 0.05, AAV2-5HRE-bFGF-NSCs verse AAV2-5HRE-NSCs group, ** is represented the p < 0.01, versus the SCI group or sham group, and finally ## is represented the p < 0.01, versus the AAV2-5HRE-NSCs group [45].


