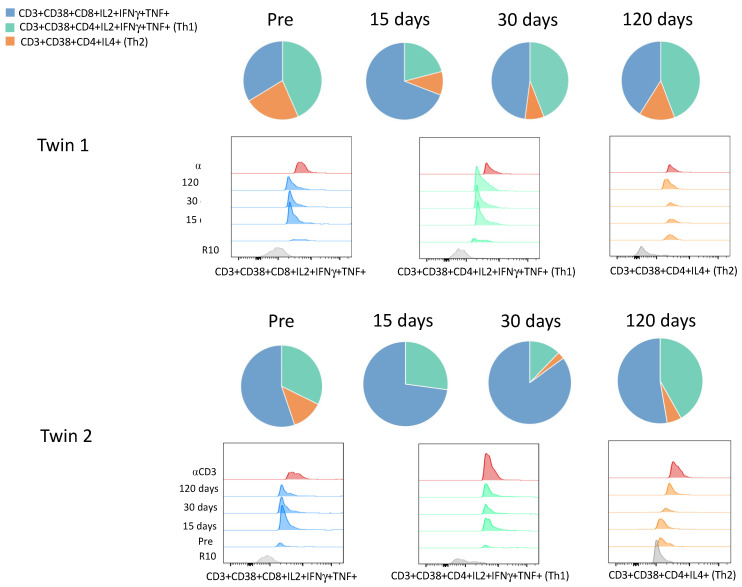
Figure 3.
Cytokines production by CD4+ and CD8+ T lymphocytes. The pie charts show the distribution of cytotoxic CD8+ T (CD3+CD38+CD8+IL2+IFNγ+TNF+), CD4+ Th1 (CD3+CD38+CD4+IL2+IFNγ+TNF+), and CD4+ Th2 (CD3+CD38+CD4+IL4+) cells upon spike glycoprotein stimulation after vaccination for the twins over time. The histograms from FACS analysis show the expression of those cell profiles. R10: RPMI 1640 medium used as negative control for cell cultivation, αCD3: anti-CD3 monoclonal antibody used as positive control for cell cultivation. Pre: samples collected before the 1st dose of AstraZeneca COVID-19 vaccine, day 0.

