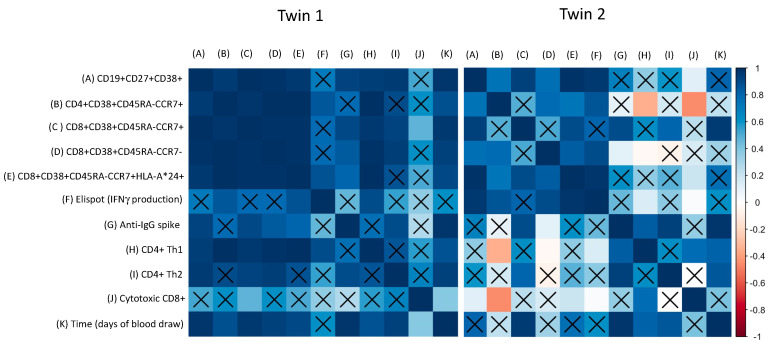
Figure 4.
Correlation between humoral and cellular response upon COVID-19 vaccination. The correlation was calculated with individual data from the twins. (A) activated memory B cells, (B) central memory CD4+ T cells, (C) central memory CD8+ T cells, (D) effector memory CD8+ T cells, (E) central memory CD8+ T cells expressing HLA type, (F) IFNγ-secreted cells (Elispot assay), (G) anti-IgG spike (serological assay), (H) activated CD4+ Th1 cells (CD4+IL2+IFNγ+TNF+), (I) activated CD4+ Th2 cells (CD4+IL4+), (J) activated cytotoxic CD8+ T cells (CD8+IL2+ IFNγ+TNF+), (K) time points of blood collection. Insignificant p values (p > 0.05) are highlighted with X.

