Fig. 3.
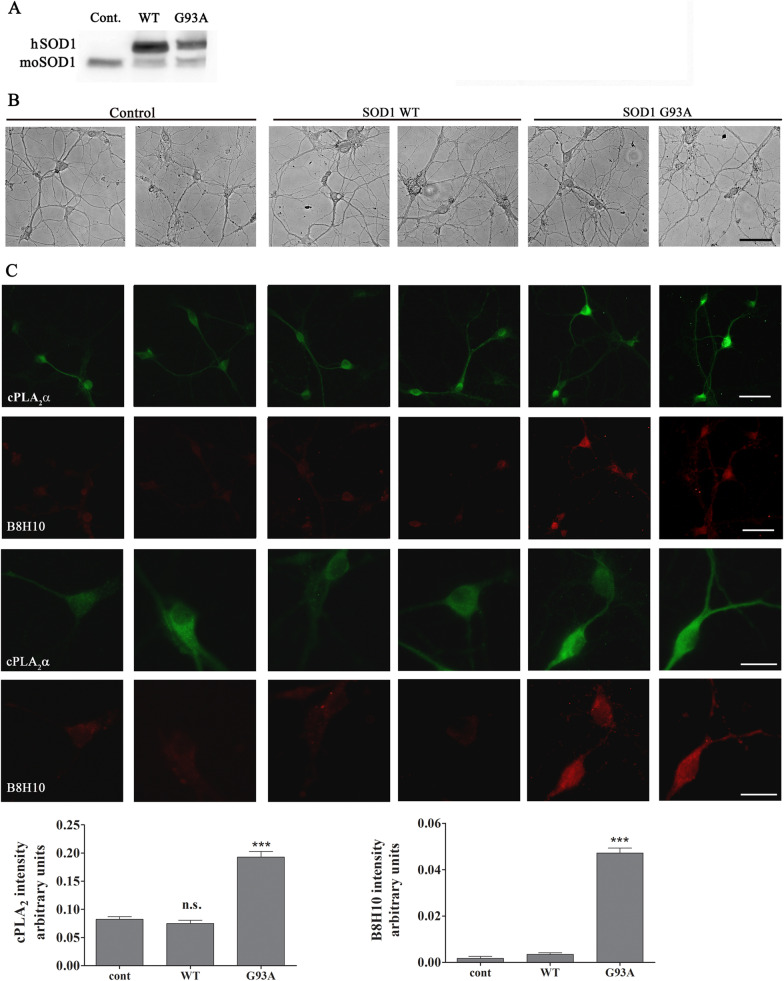
Accumulation of misfolded SOD1 in primary motor neurons induced cPLA2α upregulation. A Immunoblot analysis of human SOD1WT or mutant SOD1G93A (hSOD1), expressed in primary motor neurons by infection of AAV1/2 as described in materials and methods. Immunoblot analysis of mouse SOD1 (mSOD1) is shown as a control. B Light microscope pictures of primary motor neurons. Control—without infection, motor neurons expressing human wild type SOD1 (SOD1 WT) or mutant SOD1 (SOD1 G93A). Scale bars = 50 μm. C Double immunofluorescence staining of cPLA2α (green) with misfolded SOD1 (B8H10, red) in motor neurons expressing SOD1WT, mutant SOD1G93A and control cells. Two upper panels scale bars = 50 μm and two lower panels scale bars = 20 μm. 3 different independent experiments were analyzed and showed similar results. The means ± SEM fluorescence intensity for cPLA2α and misfolded SOD1 is presented in the bar graphs as arbitrary units. Five fields in each of the 3 different treatments of motor neurons in each experiment was analyzed. Significance compared to control ***p < 0.001, n.s. non-significant

