Fig. 7.
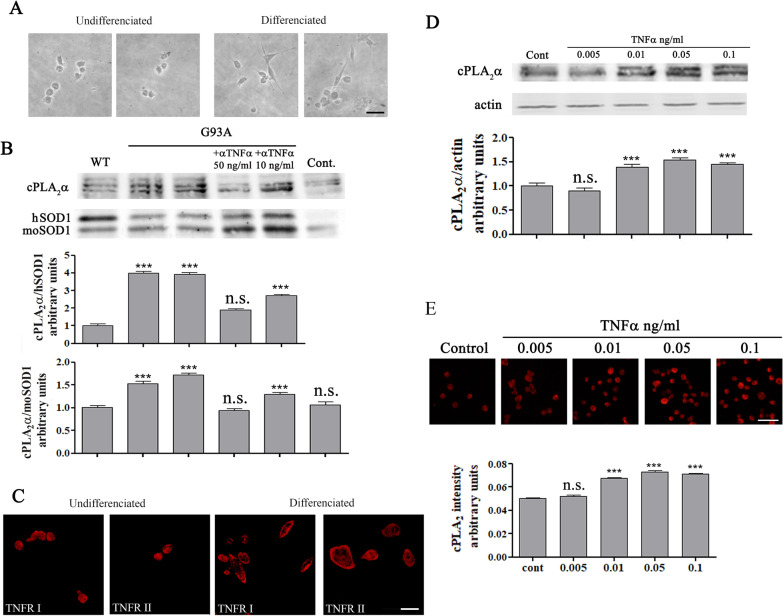
Secreted TNFα is responsible for cPLA2α upregulation. A Representative light microscope pictures of undifferentiated and differentiated motor like NSC34 cells, scale bars = 50 μm. B cPLA2α upregulation induced by mutant SOD1G93A expressing cells is prevented in the presence of anti-TNFα antibodies. NSC-34 cells were transfected with human SOD1WT or mutant SOD1G93A plasmids for 72 h before lysates preparations. TNFα neutralizing antibodies were added at 48 h. A representative immunoblot analysis of cPLA2α in NSC34 cells transfected with human SOD1WT (WT) or mutant SOD1G93A (G93A) in the absence or presence of anti-TNFα. Control cells without transfection (Cont.). cPLA2α protein expression was determined by dividing the intensity of each cPLA2α with the intensity of the corresponding human SOD1 or mouse SOD1 after quantitation by densitometry and expressed in the bar graph as arbitrary units. The bar graphs are the means ± SE of three experiments. Significance compared to control ***p < 0.001, n.s. non-significant. C Representative confocal pictures of immunofluorescence staining of TNFRI and TNFRII in undifferentiated and differentiated motor like NSC34 cells, scale bars = 20 μm. Two other experiments showed similar results. D A representative immunoblot analysis of a dose dependent effect of TNFα (0.005–0.1 ng/ml) for 24 h on cPLA2α expression in differentiated motor neuron-like NSC34 cells. cPLA2α protein expression was determined by dividing the intensity of each cPLA2α with the intensity of the corresponding actin after quantitation by densitometry and expressed in the bar graph as arbitrary units. The bar graphs are the means ± SE of 3 experiments. Significance compared to control ***p < 0.001, n.s. non-significant. E A representative immunofluorescence staining of a dose dependent effect of TNFα (0.05–0.1 ng/ml) for 24 h on cPLA2α expression in differentiated motor neuron-like NSC34 cells. Scale bars = 50 μm. The bar graph is the mean ± SE of 3 different experiments. Significance compared to control ***p < 0.001, n.s. non-significant

