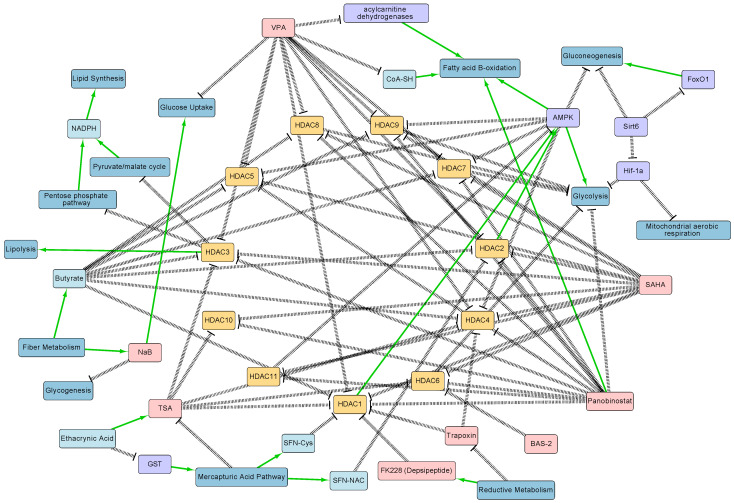
Figure 1.
HDAC–metabolic interaction network diagram generated from literature curation. Salient regulatory interactions between HDACs 1-11, metabolites, and metabolic pathways are shown. Note that this diagram is not comprehensive and does not show all interactions between these processes. HDACs are represented in yellow, HDAC inhibitors in red, metabolites in light blue, metabolic pathways in dark blue, and proteins in purple. Positive regulatory arrows are depicted in green and negative regulatory arrows in black. The network map was created in Cytoscape. The figure highlights the complexity of the interactions between HDACs and metabolism, and highlights the need for systems biology approaches to study their interplay.

