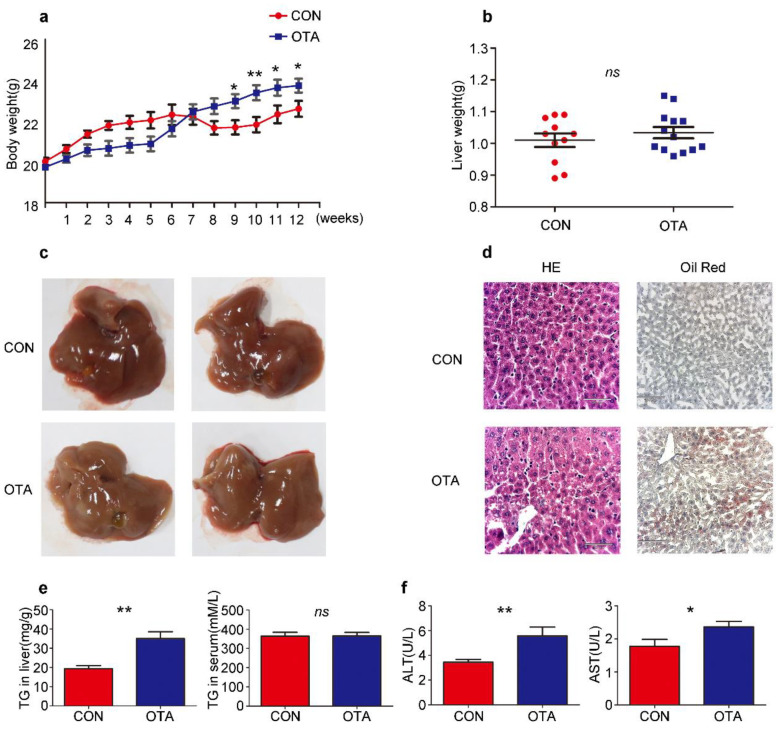
Figure 3.
OTA induces simple steatosis in vivo. Mice are treated with OTA or NaHCO3 for 12 weeks (n = 12 in each group). Effects of OTA on mouse: body weight (a), liver weight (b), representative images of livers (c), H&E and Oil Red O staining of liver sections of control and OTA-treated mice (d), liver TG contents and serum TG levels (e), serum ALT levels and AST levels (f). Data shown as the mean ± S.E.M. * p < 0.05 and ** p < 0.01, ns means no significant difference.

