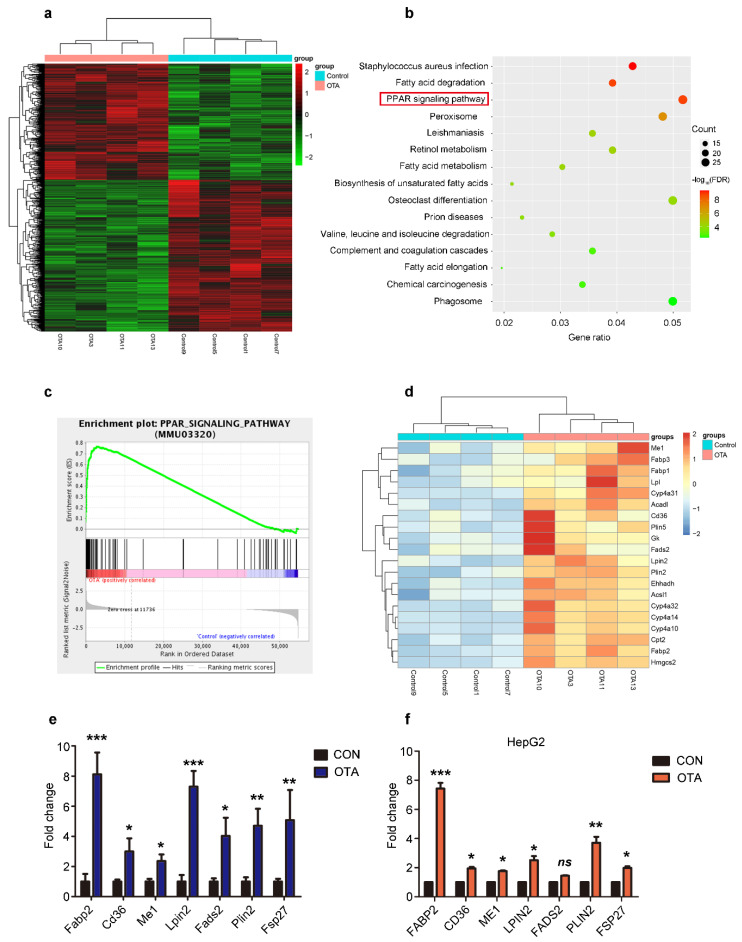
Figure 4.
Reprogramming of hepatic gene expression after OTA treatment. (a) Heatmap for clustering analysis of genes in the livers of control and OTA-treated mice. (b) KEGG analysis showing top 15 enriched pathways in OTA-treated livers with p < 0.05. (c) Results of GSEA showed PPAR signaling pathway were differentially enriched upon OTA treatment. (d) Heatmaps of hepatic RNA-seq raw gene counts for PPAR signaling pathway. (e) Examination of top upregulated genes associated with lipid metabolism in livers of control and OTA-treated mice (n = 12 in each group) by qPCR. (f) Examination of top upregulated genes associated with lipid metabolism in HepG2 cells by qPCR (n = 6 biological replicates). Data shown as the mean ± S.E.M. * p < 0.05, ** p < 0.01 and *** p < 0.001.

