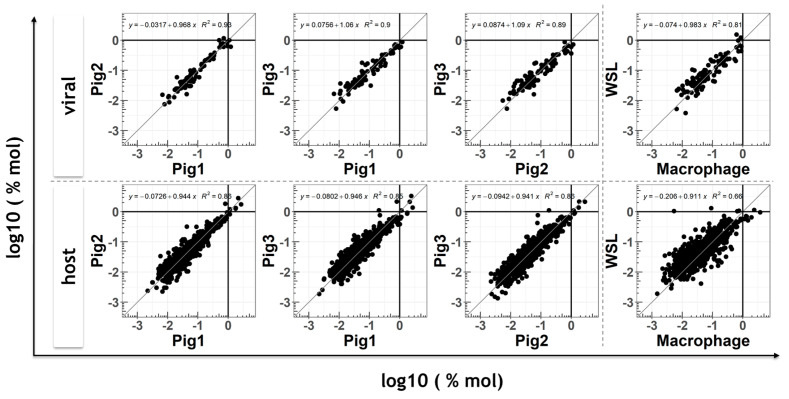
Figure 4.
Comparison of viral and host gene expression levels. Scatter plots of viral (upper row) and host (lower row) protein levels representing moMΦ preparations from different pigs and WSL cells (far right panels). Mean expression levels (%mol concentrations) of at least 3 biological replicates are shown after log10 transformation (data taken from Supplementary Table ‘S7_MS-quantification.xlsx’). N = 3 for the comparison of individual pigs. In the right panels, the means of 9 moMΦ and 3 WSL samples are shown. The dissecting lines are shown as references in gray.

