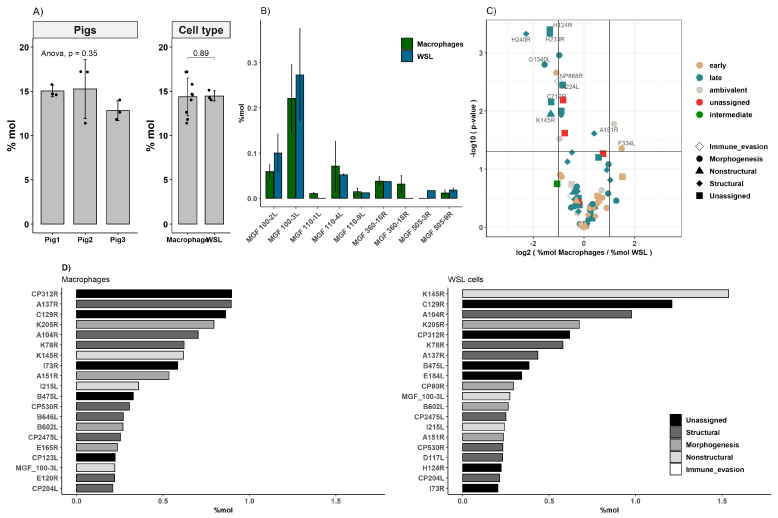
Figure 5.
Expression of viral proteins in moMΦ and WSL cells. (A) Quantitative analysis of viral protein expression as proportion of whole proteome. (B) Expression of MGF members. (C) Volcano plot representing differential expression of proteins belonging to different functional group and kinetic classes, the horizontal line corresponds to p = 0.05 (two-sided t-test), vertical lines to fold-changes of 2 and 0.5, respectively, n(moMΦ) = 9, n(WSL) = 3. (D) Mean expression levels in mole percent (%mol) of most abundantly expressed viral proteins in moMΦ and WSL cells.

