Figure 1.
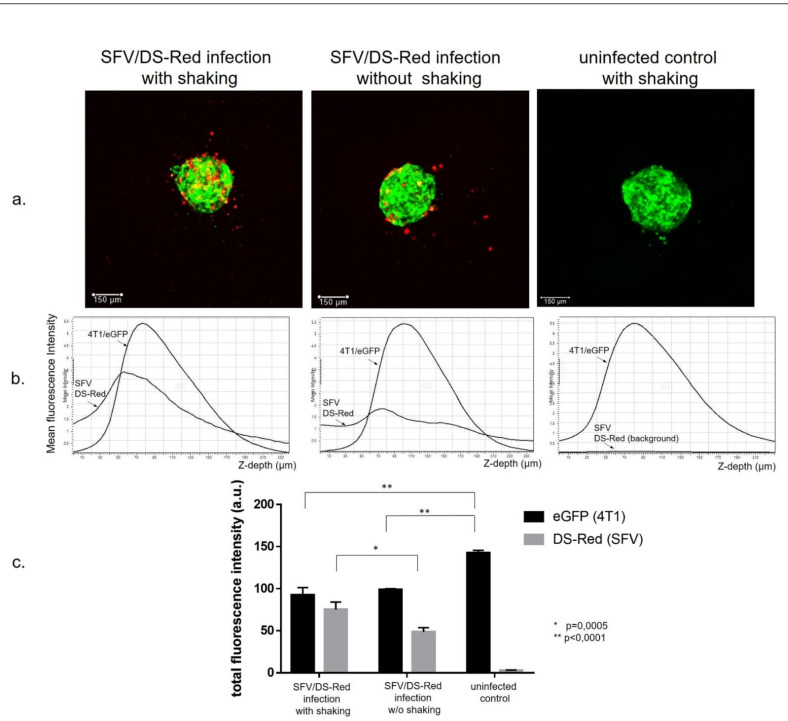
Infection of the 4T1/eGFP cancer cell spheroids with recombinant SFV/DS-Red virus. The 4T1/eGFP cells (3 × 10³ cells per well) were plated into 96-well ultralow attachment plates. The next day, the spheroids were infected with SFV/DS-Red virus (105 i.u./well) either with or without shaking during incubation with the virus (1 h 10 min). Then, the spheroids were incubated for 2 days to allow DS-Red transgene expression. Confocal microscopy was performed using a Leica TCS SP8 microscope, and the images were processed by LasX software as described in the methods. (a) Maximum intensity projection confocal images of the 4T1/eGFP spheroids infected with SFV/DS-Red virus (representative images). (b) Graphical analysis of the mean fluorescence intensity changes from the spheroid upper rim to the spheroid bottom. The eGFP and DS-Red signal curves are indicated by arrows; 48 planes, z step 5 µm. (c) Total fluorescence intensity of the spheroids incubated with or without shaking during infection and the uninfected spheroid controls. Data are presented as the mean of total fluorescence of four spheroids in each group. Error bars represent the standard deviation, n = 4. Statistical analysis was performed by Tukey’s multiple comparison test.

